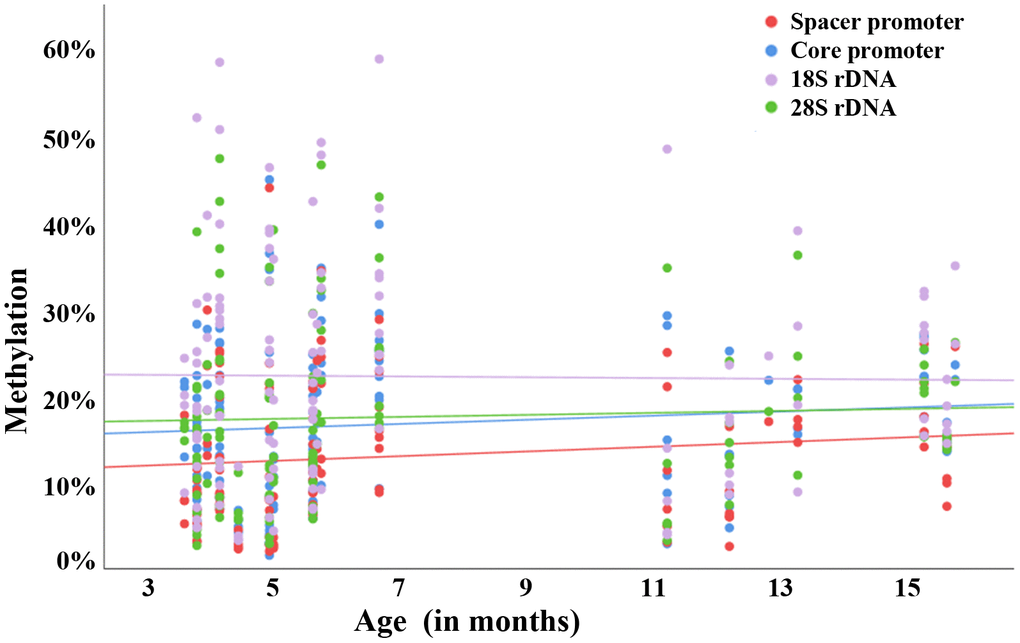
Figure 3.Raw correlation between rDNA methylation and donor age in individual mouse oocytes. Scatter plot showing a positive correlation between donor age (x-axis in months) and methylation (y-axis in %) of the rDNA spacer promoter (red dots), core promoter (blue dots), 18S rDNA (mauve dots), and 28S rDNA (green dots). Altogether, 123 GV oocytes from 29 4-16-months-old mice were analyzed. Each dot represents an individual oocyte.