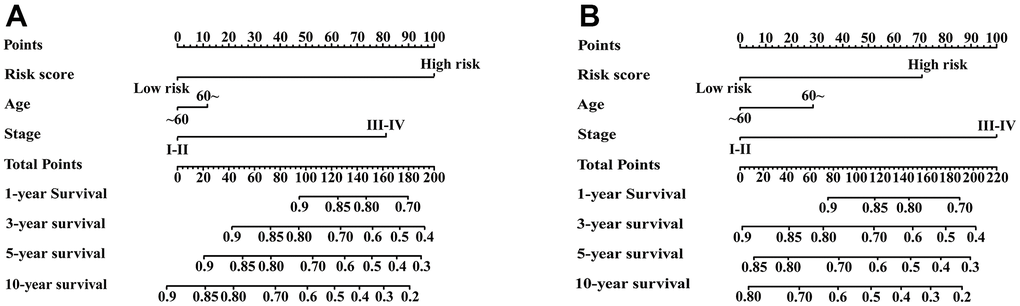
Figure 7.Nomograms constructed for predicting 1-, 3-, 5-, and 10-year RFS. (A) Nomograms predicting 1-, 3-, 5- and 10-year RFS rates among patients in the meta-training set. (B) Nomograms predicting 1-, 3-, 5- and 10-year RFS rates among patients in the meta-validation set.