Submit an Article
Navigate
Home
Editorial Board
Editorial Policies
Current Volume
Archive
Scientific Integrity
Publication Ethics Statements
Interviews with Outstanding Authors
Newsroom
Sponsored Conferences
Podcast
Contact
Special Collections
Submit an Article
Online ISSN: 1945-4589
Research Paper
|
Volume 14, Issue 3
|
pp. 1336–1350
Hyperintensities of middle frontal gyrus in patients with diabetic optic neuropathy: a dynamic amplitude of low-frequency fluctuation study
Back to article
Figure 3
(3 of 6)
−
100%
+
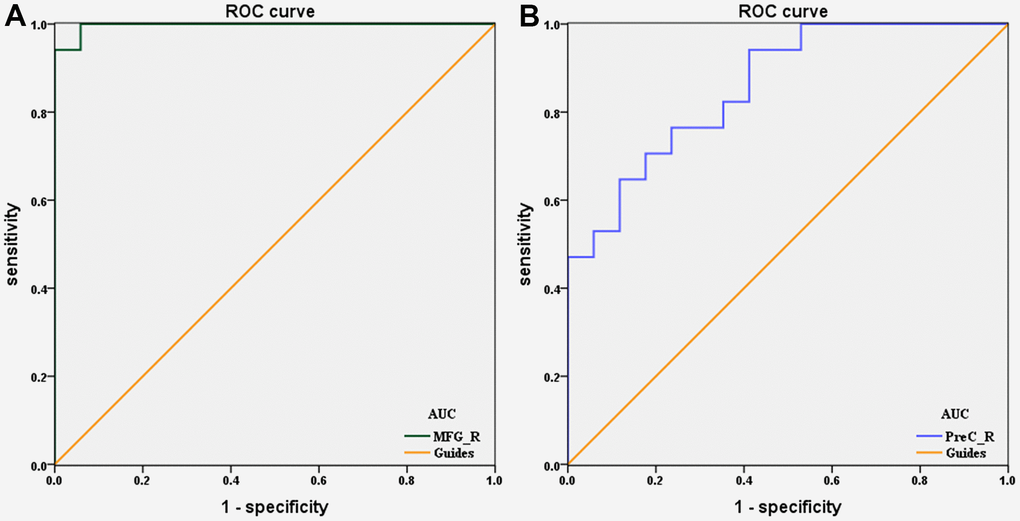
Figure 3.
ROC curve analysis of the mean dALFF values for altered brain regions.
(
A
) DON>HCs, the area under the ROC curve was 0.997 (P < 0.0001; 95% CI: 0.985–1.000) for MFG_R. (
B
) DON