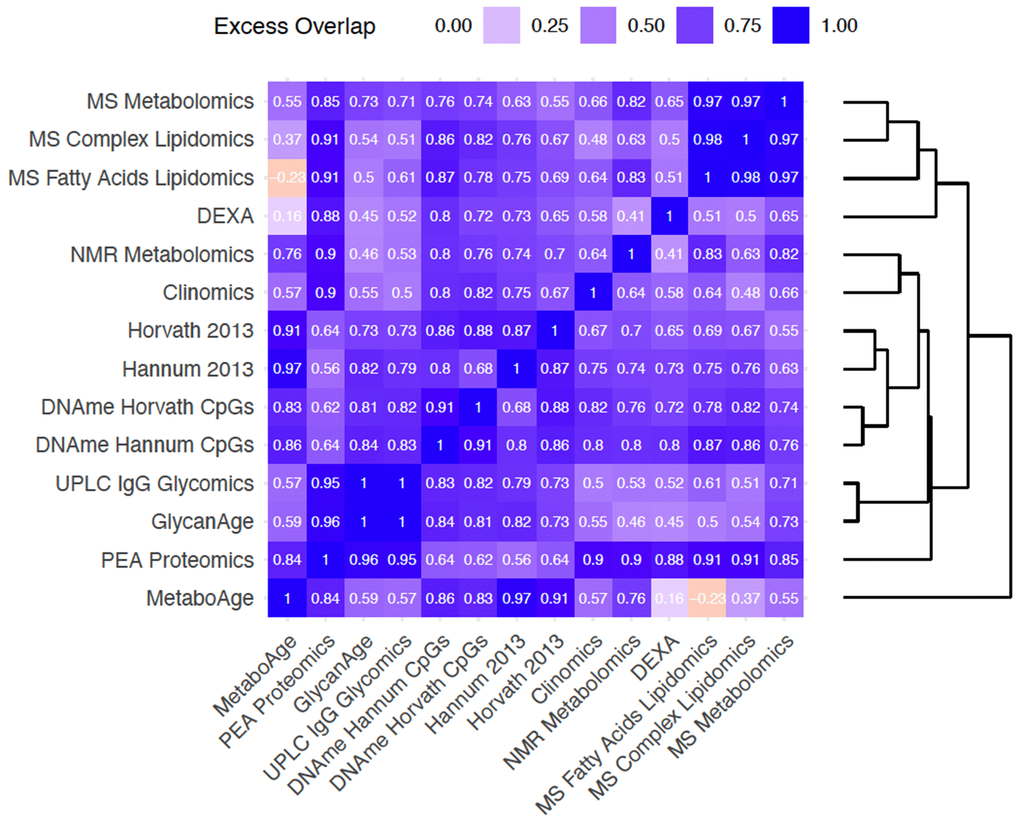
Figure 4.Bivariate analyses reveal that clock pairs tend to overlap more than expected by chance in the variance in chronAge they explain. The amount of excess overlap that would be expected by chance is indicated for each pair of clocks. This is the deviation of the observed variance in chronAge explained by a bivariate model containing a pair of OCAs and the variance expected to be explained by that pair given that we know how much variance in chronAge they explain individually, if each of the clocks were independent samples from a set of latent complete predictors. This measure of deviation of observed from expected is scaled (See Methods for details) so that a value of 1 means that the second clock is adding no more information than the first, meaning that they overlap entirely in the information they provide about chronAge. A value of 0 would indicate the observed variance explained in chronAge is exactly what is expected if the two clocks were independently sampling. Negative values indicate disproportionately complementary components of chronAge were being tracked.