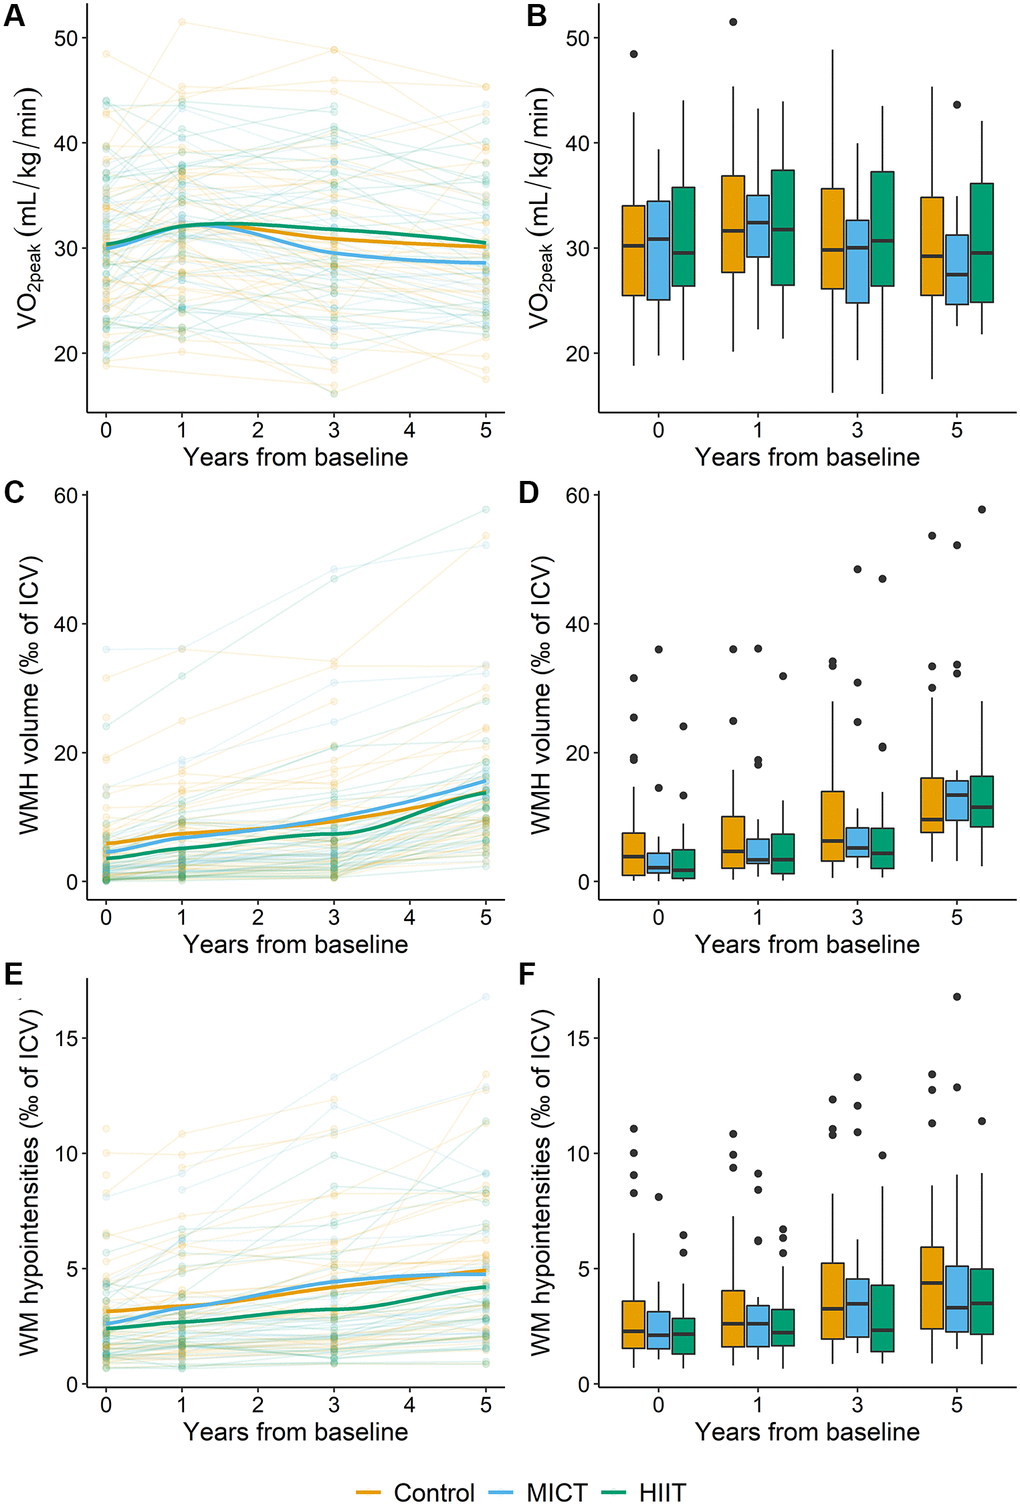
Figure 2.Overview of the development of VO2peak, WMH and WM-hypointensity volumes (given as ‰ of ICV) in the control (orange), MICT (blue) and HIIT (green) groups during the five-year intervention period. (A) Each line represents the VO2peak values for an individual participant according to group adherence with the thicker lines representing the mean of each group. (B) Box plot of VO2peak in the three intervention groups during the intervention period. (C) Each line represents the WMH volume as ‰ of ICV for an individual participant according to group adherence with the thicker lines representing the mean of each group. (D) Box plot of WMH volume as ‰ of ICV in the three intervention groups during the intervention. (E) Each line represents the WM-hypointensity volume as ‰ of ICV for an individual participant according to group adherence with the thicker lines representing the mean of each group. (F) Box plot of WM-hypointensity volume as ‰ of ICV in the three intervention groups during the intervention. In the box plots (B, D, and F), the box indicates the interquartile range with the top line of the box representing the third quartile and the bottom line representing the first quartile. The whiskers extend up to the minimum or maximum values, but no further than 1.5 times the interquartile range, and the black dots represent data beyond the end of the whiskers. Abbreviations: VO2peak: peak oxygen uptake; WMH: white matter hyperintensities; ICV: intracranial volume; WM: white matter; MICT: moderate-intensity continuous training; HIIT: high-intensity interval training.