Submit an Article
Navigate
Home
Editorial Board
Editorial Policies
Current Volume
Archive
Scientific Integrity
Publication Ethics Statements
Interviews with Outstanding Authors
Newsroom
Sponsored Conferences
Podcast
Contact
Special Collections
Submit an Article
Online ISSN: 1945-4589
Research Paper
|
Volume 14, Issue 1
|
pp. 443–461
PEGylation and antioxidant effects of a human glutathione peroxidase 1 mutant
Back to article
Figure 5
(5 of 13)
−
100%
+
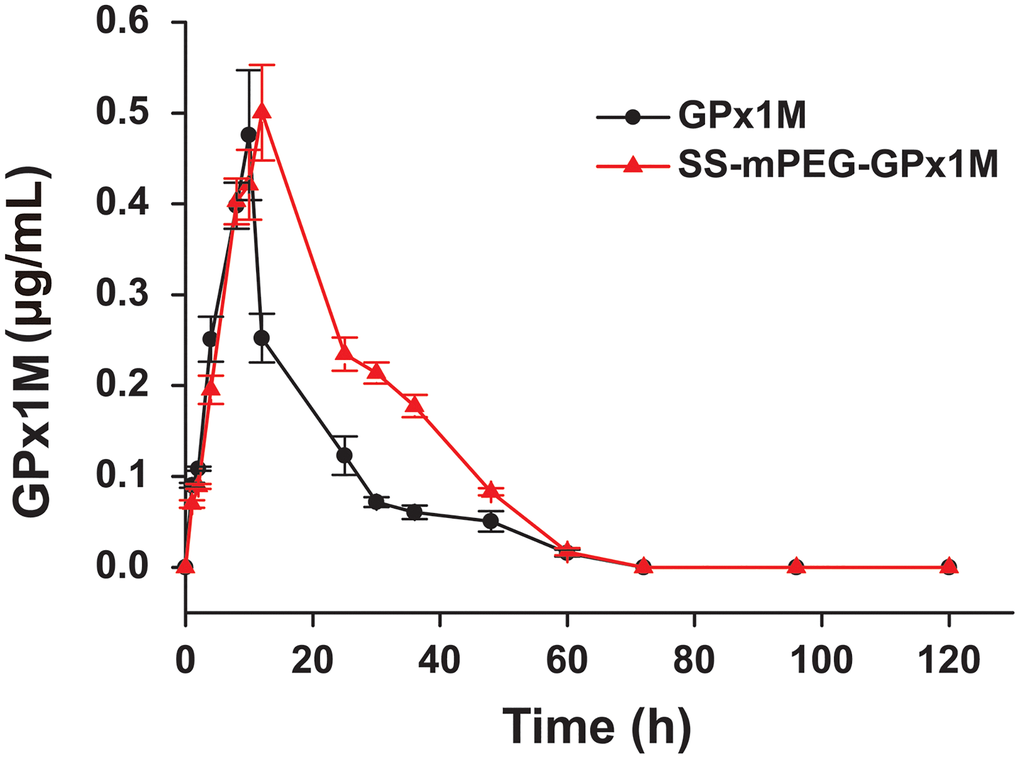
Figure 5.
Blood concentration of GPx1M and SS-mPEG-GPx1M.
All data were showed as mean ± SD (
n
= 4).