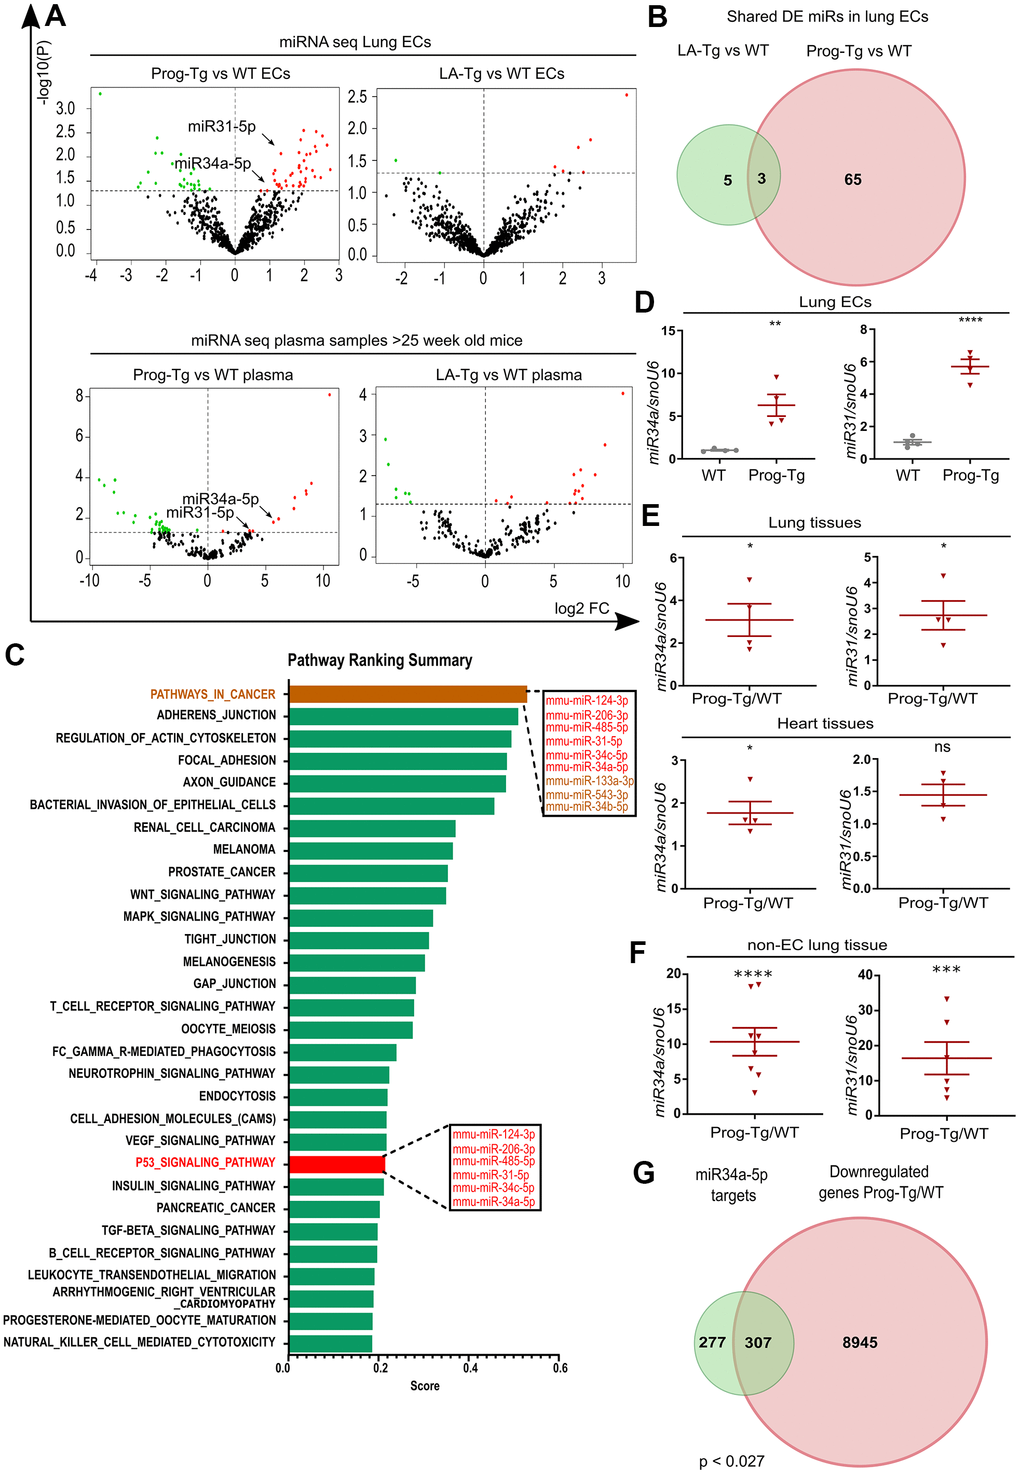
Figure 5.Senescent progerin-expressing ECs display a specific senescence-associated miR signature. (A) Volcano plots exhibiting differential expression (DE) analysis of miRs in Prog-Tg/WT and LA-Tg/WT lung ECs (upper panels) and in plasma samples of >25-week-old mice (lower panels) using threshold as depicted in Figure 1A (n=3). (B) Venn diagram showing overlap of DE miRs in Prog-Tg/WT and LA-Tg/WT lung ECs (topGO and GOstats packages in R/Bioconductor were used). (C) Bar graph representing the predicted top 30 pathways for the targetome of significantly DE miRs in Prog-Tg ECs with enriched term on the y-axis and ranking score on the x-axis. miRs linked to the “p53 signaling pathway” and “cancer pathway” are displayed in boxes (miRSystem version 20160513). (D) Expression levels analysed by qPCR of miR34a-5p (miR34) and miR31-5p (miR31) in cultured lung ECs normalized to small nuclear U6 RNA (snoU6). (E) Expression levels of miR34 and miR31 in the whole lung and heart tissues of Prog-Tg vs WT mice (>25 weeks) normalized to snoU6. (F) Expression levels of miR34a-5p and miR31-5p in non-EC populations from lung tissues of Prog-Tg vs WT mice normalized to snoU6. (G) Venn diagram displaying overlap between downregulated genes in Prog-Tg/WT lung ECs and miR34a-5p targets (Targetscan mouse) (Bioinformatics and Evolutionary Genomics). Hypergeometric test for the overlap showed a p-value of 0.027 and a representation factor of 1.1. For qPCRs n=4-8. The unpaired Students t test was used for in vitro experiments, paired Students t test for in vivo experiments using WT littermate controls. ns=non-significant, *p<0.05, **p<0.01, ***p<0.001, ****p<0.0001.