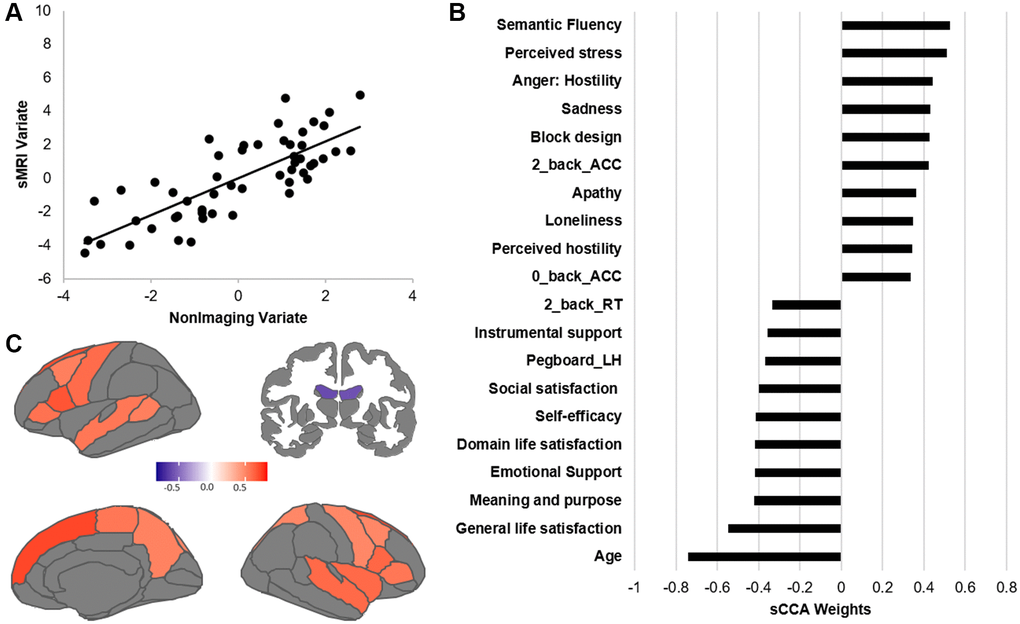
Figure 1.Results of the sCCA between non-imaging and sMRI datasets across all participants. (A) Significant correlation across all participants (r = 0.612, p = 0.0001). (B) Top behavioral–health variables most strongly associated with the imaging variate. (C) Top sMRI variables positively associated with the behavioral–health variate. Details of each variable in Supplementary Table 5. Contributions of all variables are provided in Supplementary Tables 1 and 2.
Figure 1 — Multivariate patterns of brain-behavior associations across the adult lifespan | Aging