Submit an Article
Navigate
Home
Editorial Board
Editorial Policies
Current Volume
Archive
Scientific Integrity
Publication Ethics Statements
Interviews with Outstanding Authors
Newsroom
Sponsored Conferences
Podcast
Contact
Special Collections
Submit an Article
Online ISSN: 1945-4589
Research Paper
|
Volume 14, Issue 1
|
pp. 389–409
Chordin-like 1 is a novel prognostic biomarker and correlative with immune cell infiltration in lung adenocarcinoma
Back to article
Figure 6
(6 of 8)
−
100%
+
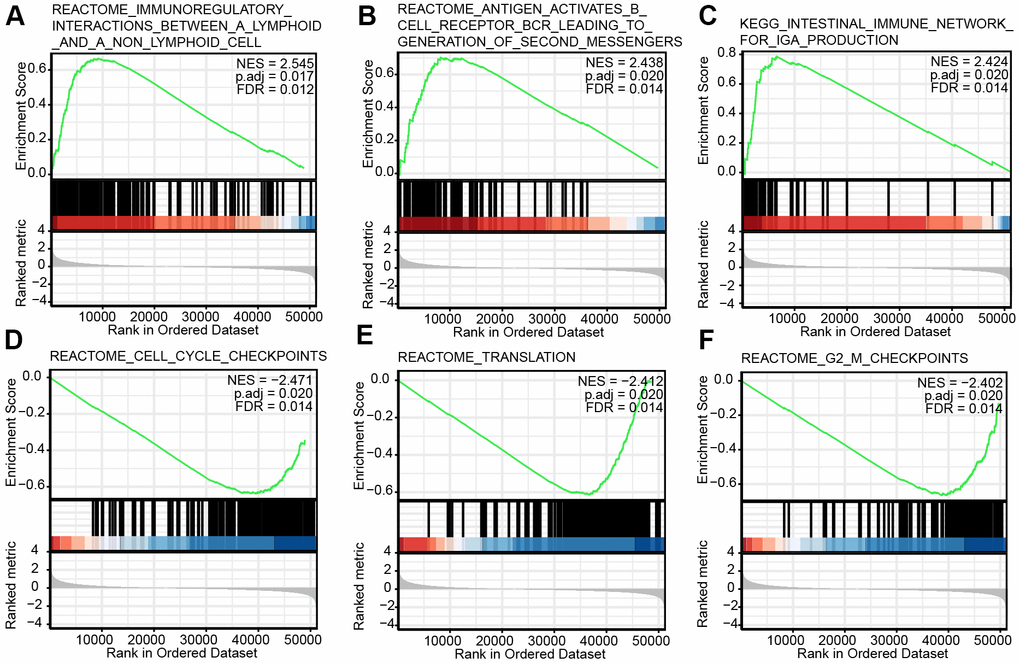
Figure 6.
Enrichment plots from the gene set enrichment analysis (GSEA).
(
A
–
F
) Several biological processes and pathways were differentially enriched in CHRDL1-related LUAD. NES, normalized ES; p.adj, adjusted P-value; FDR, false discovery rate.