Submit an Article
Navigate
Home
Editorial Board
Editorial Policies
Current Volume
Archive
Scientific Integrity
Publication Ethics Statements
Interviews with Outstanding Authors
Newsroom
Sponsored Conferences
Podcast
Contact
Special Collections
Submit an Article
Online ISSN: 1945-4589
Research Paper
|
Volume 14, Issue 1
|
pp. 354–367
Telomere length is maternally inherited and associated with lipid metabolism in Chinese population
Back to article
Figure 2
(2 of 3)
−
100%
+
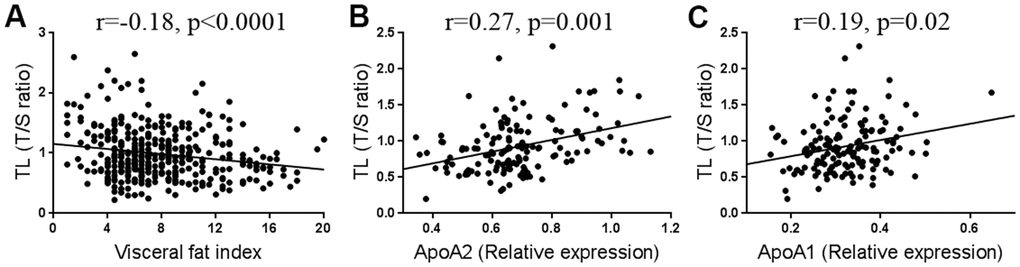
Figure 2.
Correlation between telomere length (TL) and visceral fat (n=394) (
A
), ApoA2 (n=144) (
B
), and ApoA1 levels (n=144) (
C
).