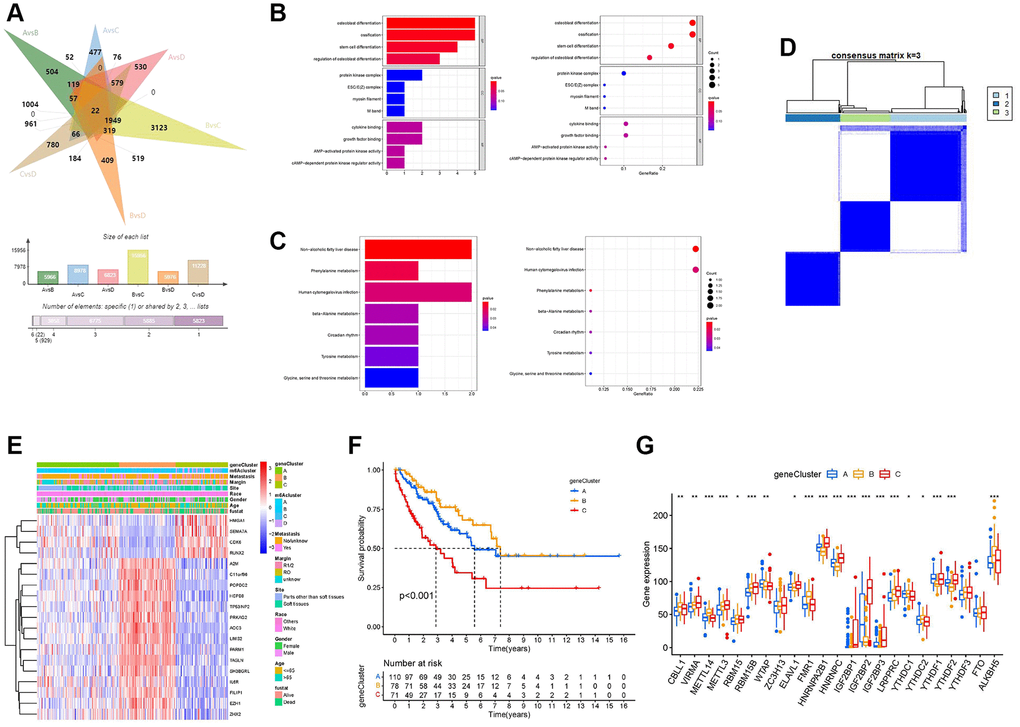
Figure 5.Development of the m6A score and exploration of functional annotation. (A) Venn diagram showing 22 m6A-associated differentially expressed genes (DEGs) between the six clusters compared. (B) Functional annotation of m6A-related DEGs using Gene Ontology (GO) enrichment analysis. (C) Functional annotation of m6A-related DEGs using Kyoto Encyclopedia of Genes and Genomes (KEGG) enrichment analysis. (D) The consensus matrix heatmap defined three m6A gene clusters. (E) The heat map shows the expression levels of 22 m6A-related DEGs in different m6A gene clusters and various clinicopathological features. (F) Kaplan-Meier curves of the overall survival rates of 259 patients with sarcoma with three m6A gene clusters. (G) Expression levels of 23 m6A regulators in each of the three m6A gene clusters. Asterisks represent the statistical P-values (*P < 0.05; **P < 0.01; ***P < 0.001).