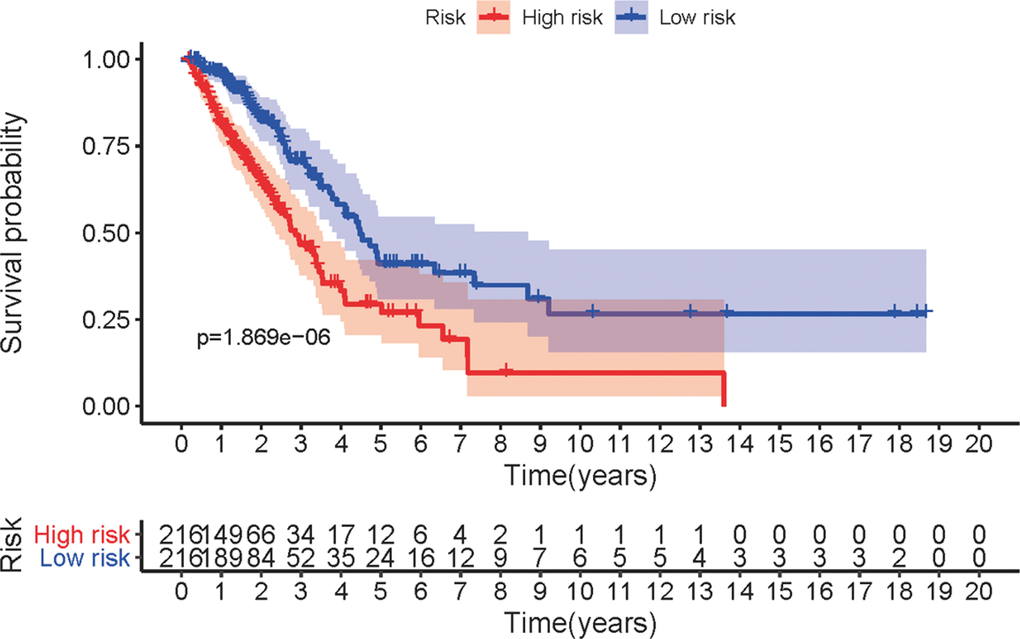
Figure 3.Survival curve of LUAC patients. Kaplan-Meier survival curve of OS in high-risk group and low-risk group. The results showed that the high-risk group have the poor prognosis.
Figure 3 — A novel immune-related long non-coding RNAs risk model for prognosis assessment of lung adenocarcinoma | Aging