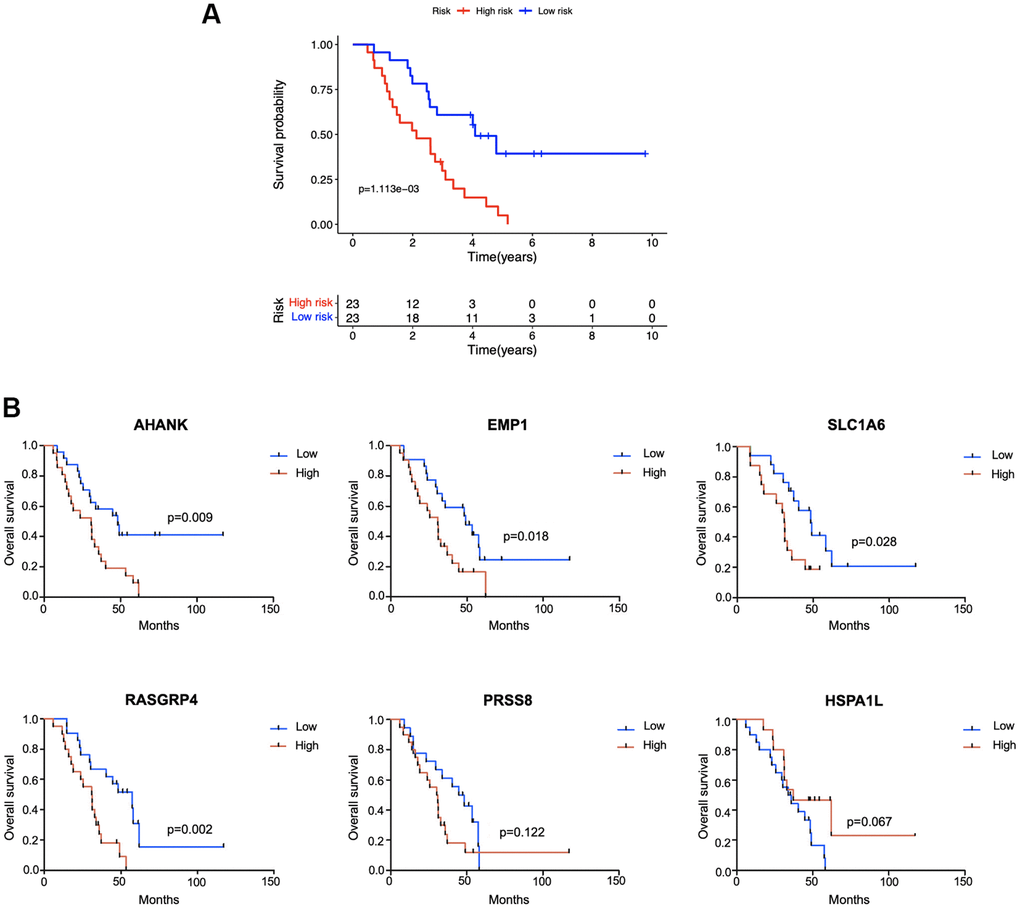
Figure 8.External validation in the Jiangsu Province Hospital cohort (n = 46). (A) Kaplan-Meier survival analysis comparing the prognosis between high-risk and low-risk patients. (B) According to the median expression level of each gene in tumor tissue samples, patients were divided into high- and low-expression groups and the survival status of the two subgroups was compared by Kaplan-Meier survival analysis.