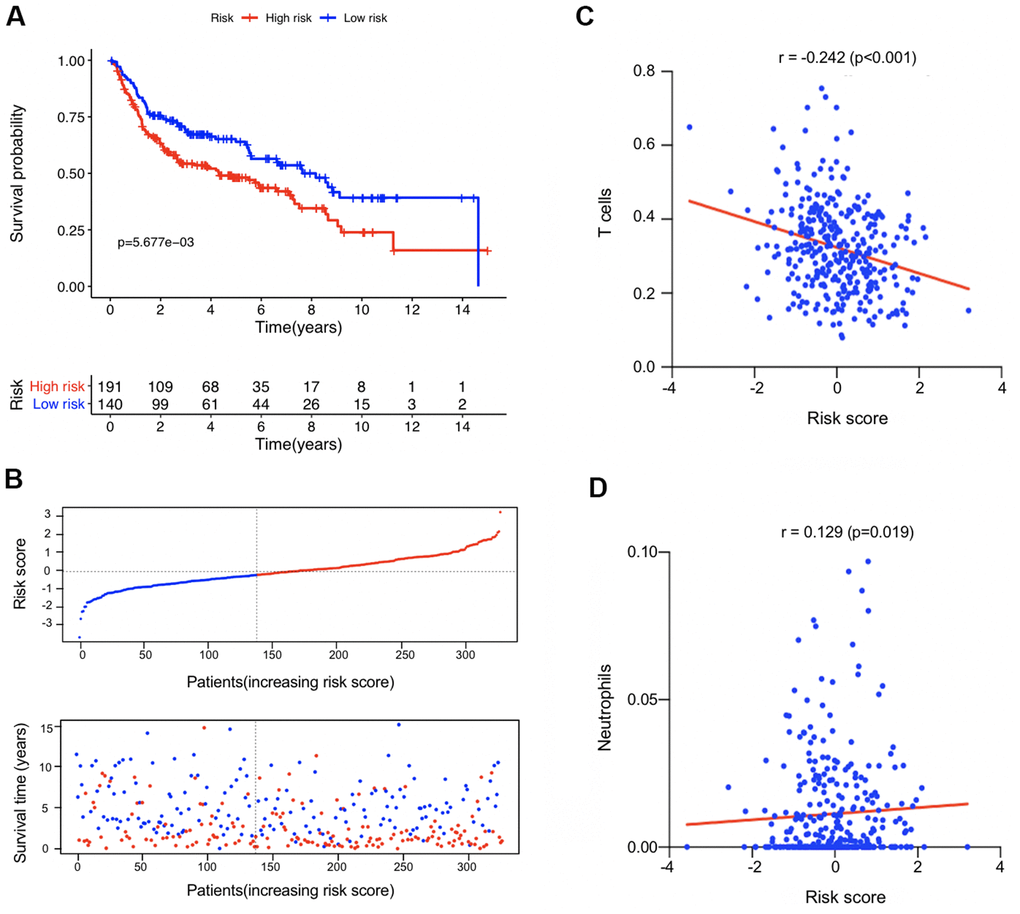
Figure 7.External validation in the combined GSE13507, GSE31684, and GSE48276 datasets (n = 331). (A) Kaplan-Meier survival analysis comparing the overall survival status between the high-risk and low-risk patients. (B) Distribution plot of the risk score and survival status of each patients. (C, D) The correlation between the estimated risk score and the proportion of T cells and neutrophils in tumor microenvironment.