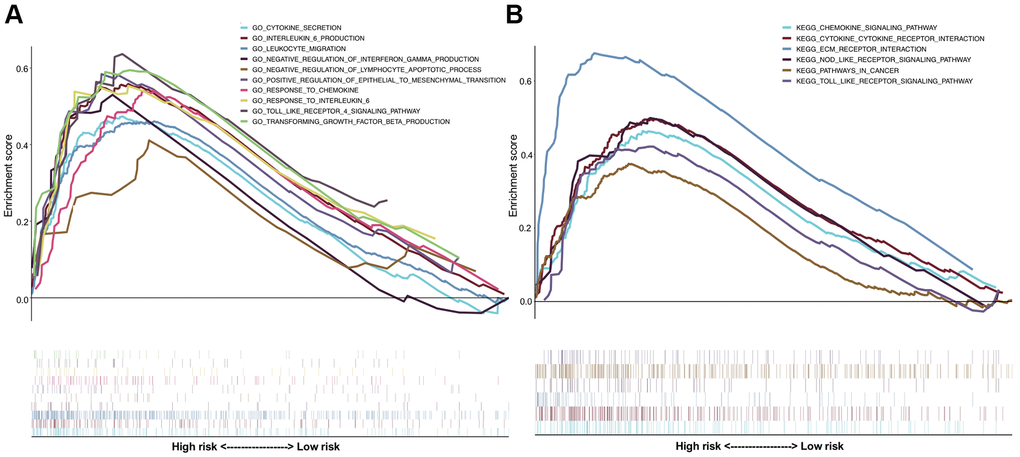
Figure 6.Gene set enrichment analysis (GSEA) comparing the significantly differential pathways involved by the high-risk and low-risk patients. (A) The results of Gene Ontology (GO) biological processes analysis; (B) the results of Kyoto Encyclopedia of Genes and Genomes (KEGG) pathway analysis.