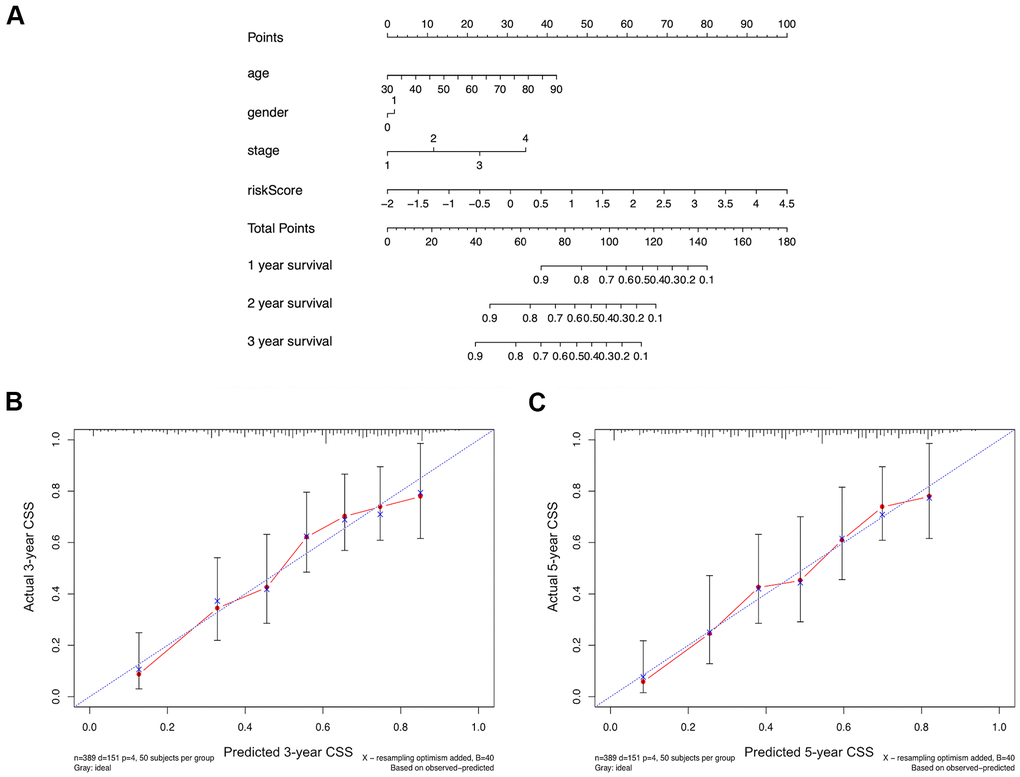
Figure 4.(A) A comprehensive nomogram integrating the estimated risk score and other clinicopathologic features for the survival prediction of bladder cancer patients using the data of TCGA-BLCA dataset. (B, C) The calibration curves comparing the predicted and actual 3-year and 5-year cancer specific survival (CSS) rates.