Submit an Article
Navigate
Home
Editorial Board
Editorial Policies
Current Volume
Archive
Scientific Integrity
Publication Ethics Statements
Interviews with Outstanding Authors
Newsroom
Sponsored Conferences
Podcast
Contact
Special Collections
Submit an Article
Online ISSN: 1945-4589
Research Paper
|
Volume 13, Issue 23
|
pp. 25466–25483
Prognostic value of CDCA3 in kidney renal papillary cell carcinoma
Back to article
Figure 9
(9 of 10)
−
100%
+
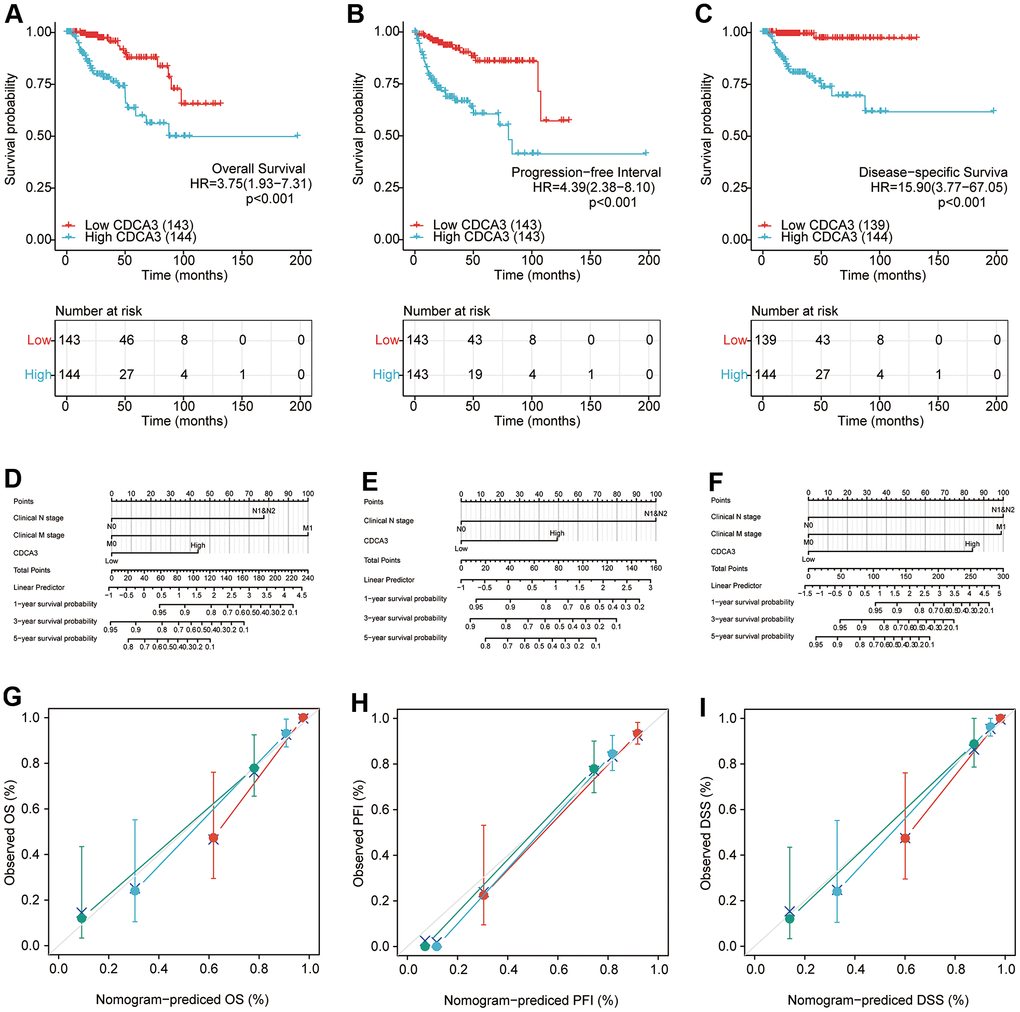
Figure 9.
Survival analyses.
(
A
–
C
)The prognostic value of CDCA3 with OS, PFI, DSS. (
D
–
F
) The nomogram of CDCA3 with OS, PFI, DSS. (
G
–
I
) The calibration curve of N stage (green), M stage (blue) and CDCA3 (red) with OS, PFI, DSS.