Submit an Article
Navigate
Home
Editorial Board
Editorial Policies
Current Volume
Archive
Scientific Integrity
Publication Ethics Statements
Interviews with Outstanding Authors
Newsroom
Sponsored Conferences
Podcast
Contact
Special Collections
Submit an Article
Online ISSN: 1945-4589
Research Paper
|
Volume 13, Issue 23
|
pp. 25466–25483
Prognostic value of CDCA3 in kidney renal papillary cell carcinoma
Back to article
Figure 2
(2 of 10)
−
100%
+
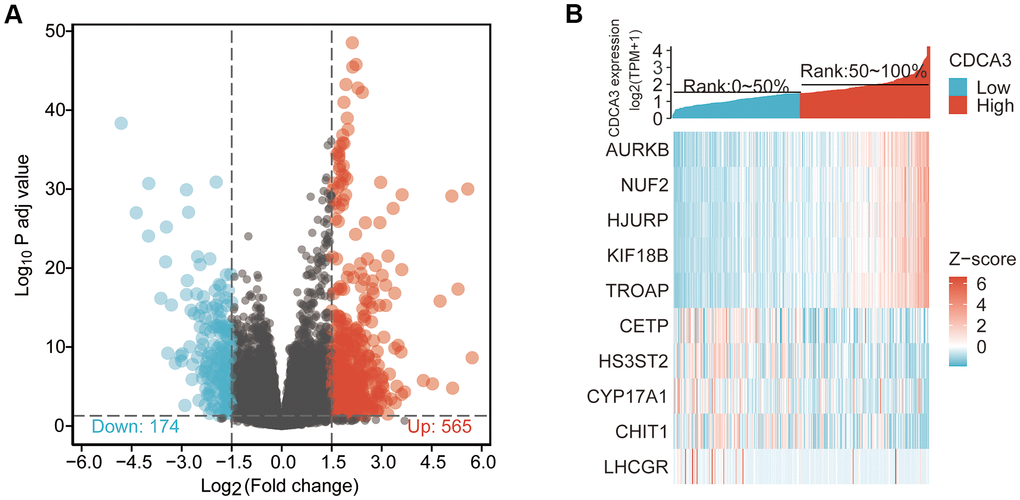
Figure 2.
DEGs associated with CDCA3 in KIRP.
(
A
) The results of the DEGs analysis with a volcano graph. |logFC| > 1.5 and
p
adj < 0.05. (
B
) The results of the most distinctly DEGs with a heat map.