Submit an Article
Navigate
Home
Editorial Board
Editorial Policies
Current Volume
Archive
Scientific Integrity
Publication Ethics Statements
Interviews with Outstanding Authors
Newsroom
Sponsored Conferences
Podcast
Contact
Special Collections
Submit an Article
Online ISSN: 1945-4589
Research Paper
|
Volume 13, Issue 24
|
pp. 25778–25798
PKMYT1, exacerbating the progression of clear cell renal cell carcinoma, is implied as a biomarker for the diagnosis and prognosis
Back to article
Figure 1
(1 of 10)
−
100%
+
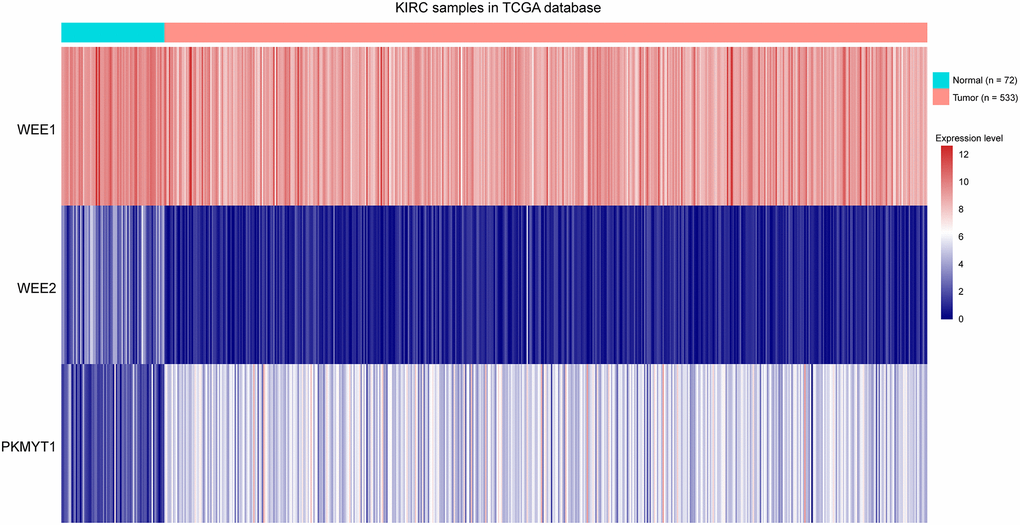
Figure 1.
Heat map showing expression levels of three members of WEE family kinases in ccRCC tumors compared to normal tissue samples.