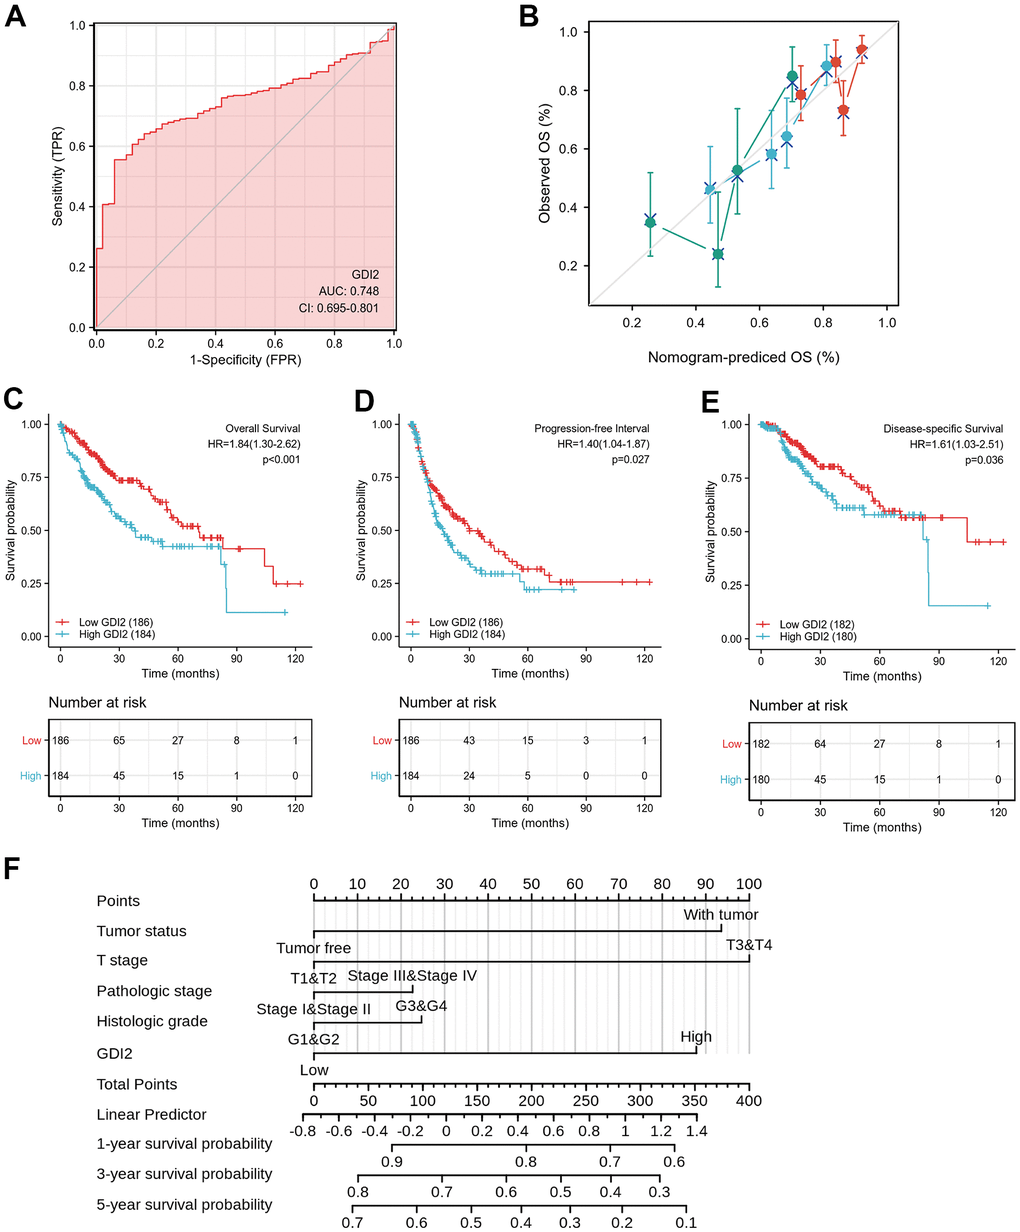
Figure 5.Effective nomogram model for prognostic evaluation of GDI2. (A) ROC analysis of GDI2 showing a high ability to discriminate controls from liver samples validated in TCGA. The X-axis represents False Positive Rate (FPR), while the Y-axis denotes True Positive Rate (TPR). AUC is plotted as sensitivity% vs 100-specifificity%. (B) Nomogram to predict survival probability at 1, 2, and 3 years of OS for HCC patients. (C–E) High GDI2 expression was associated with poor outcomes on (C) overall survival (OS), (D) progression-free interval (PFI), and (E) disease-specific survival (DSS) in HCC patients of a TCGA cohort. Blue: high GDI2 (n=184); Red: low GDI2 (n=186). *P < 0.05; **P < 0.01. (F) Calibration curve with Hosmer-Lemeshow test of the nomogram-predicted OS (%) in the TCGA-LIHC cohort relating to GDI2 expression and tumor status, as well as T Stage, Pathologic Stage and Histologic Grade. The X-axis represents Prognostic Probability (0-100%), while the Y-axis denotes Observed OS (0-100%). Gray line: ideal line.