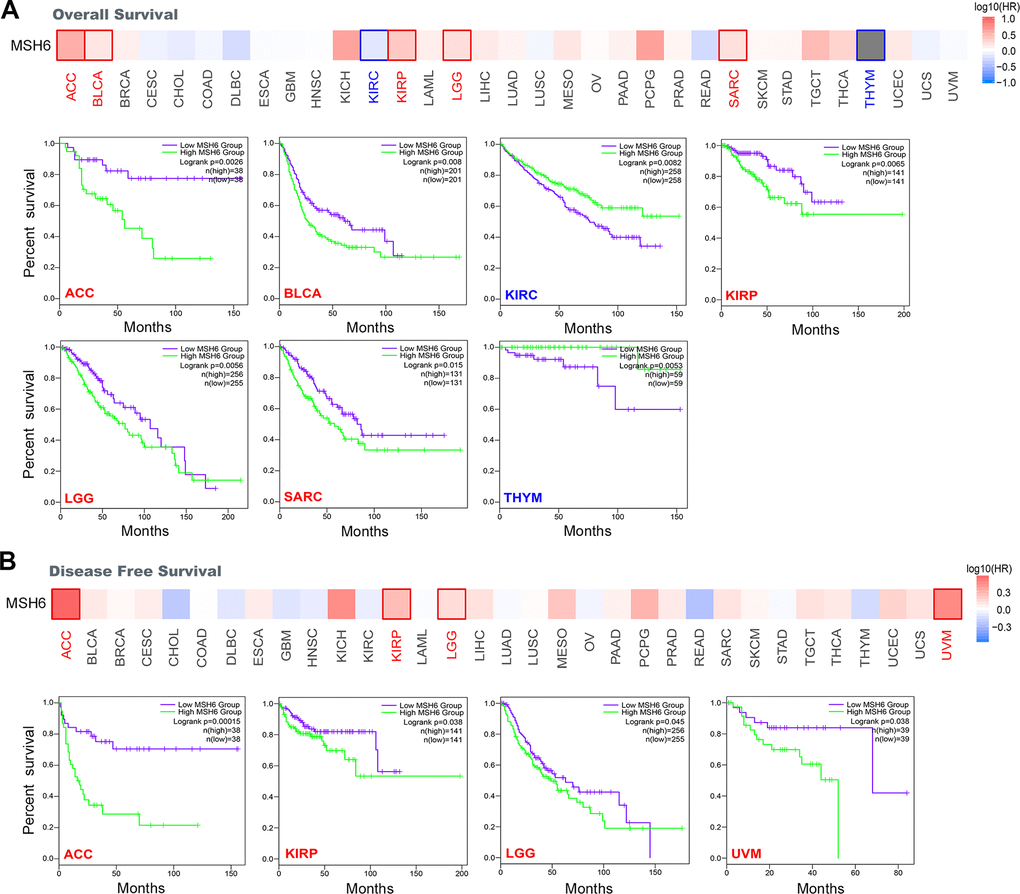
Figure 2.Correlation between MSH6 gene expression and survival prognosis of all TCGA tumors were analyzed by using the GEPIA2 tool. (A) Overall survival analysis. (B) Disease-free survival analysis. The positive results with significant differences were given through survival map and Kaplan-Meier curves.