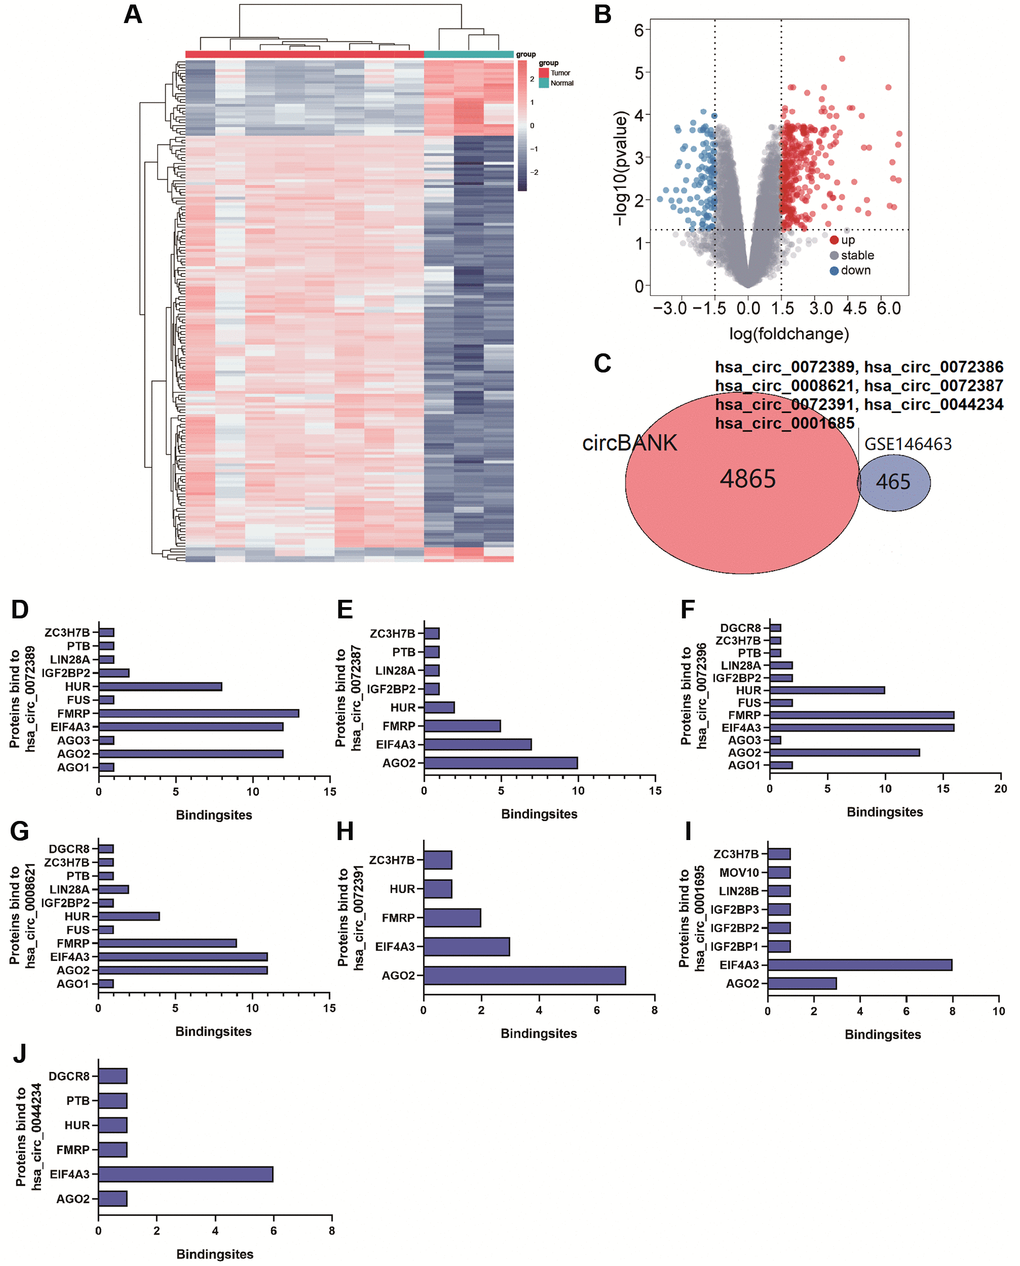
Figure 2.(A and B) Cluster analysis and volcano map demonstrate differential circRNAs in gliomas of GSE146463. (C) Venn Diagram shows circRNAs bound to miR-338-5p. (D–J) The bar graph shows proteins and the number of binding sites bound to hsa_circ_0072389, hsa_circ_0072386, hsa_circ_0008621, hsa_circ_0072387, hsa_circ_0072391, hsa_circ_0044234, hsa_circ_0001685.