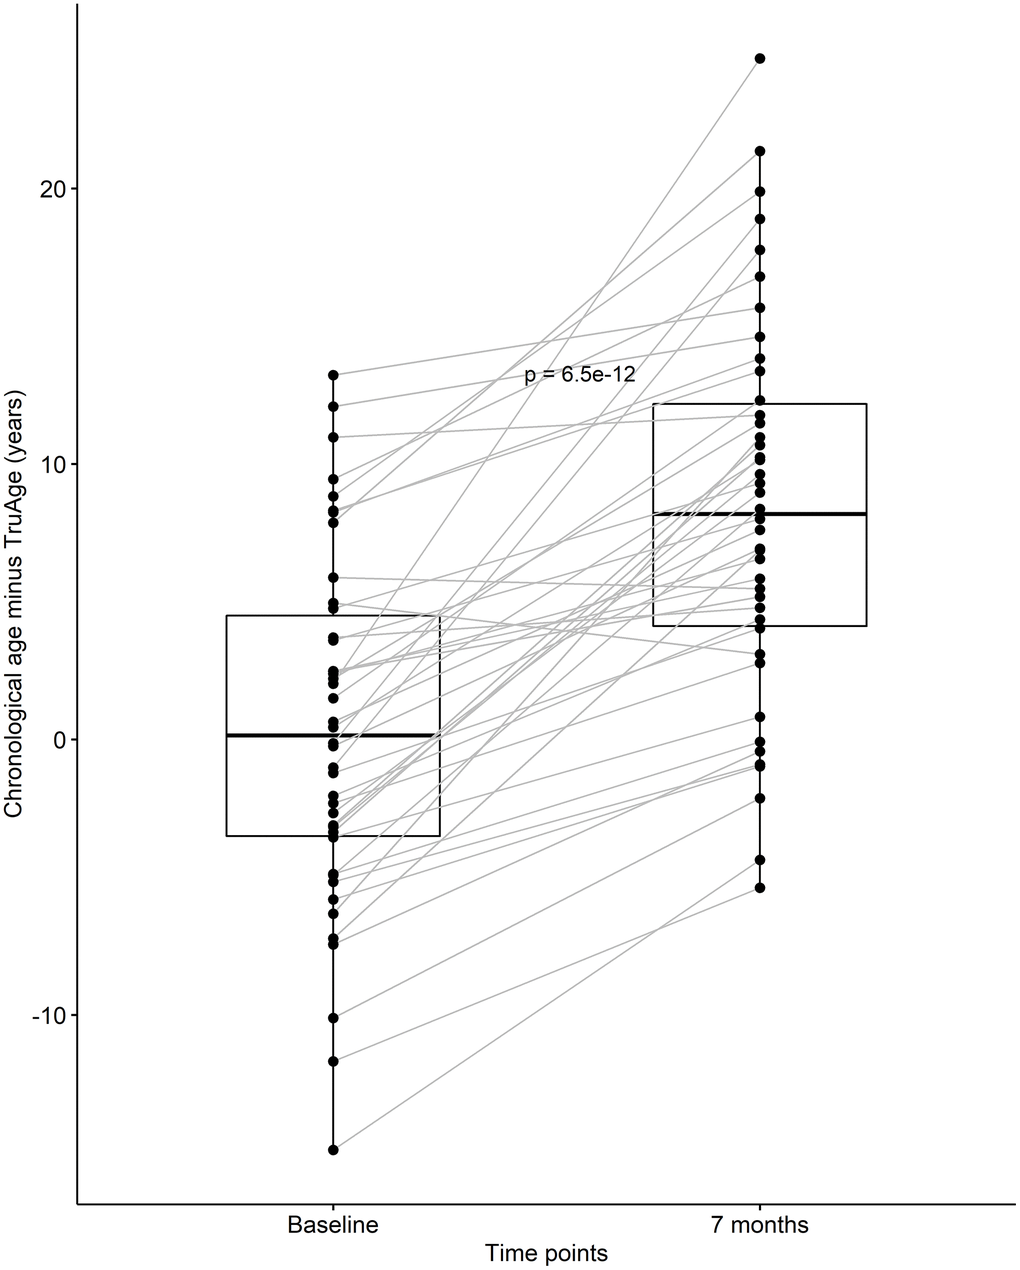
Figure 4.CaAKG decreased methylation age in the entire cohort. The paired box plots represent the treatment effects at the patient and group level (n=42), between baseline and end of the trial (which on average had a duration of 7 months). The box plots depict the median and the 25th and 75th quartiles.