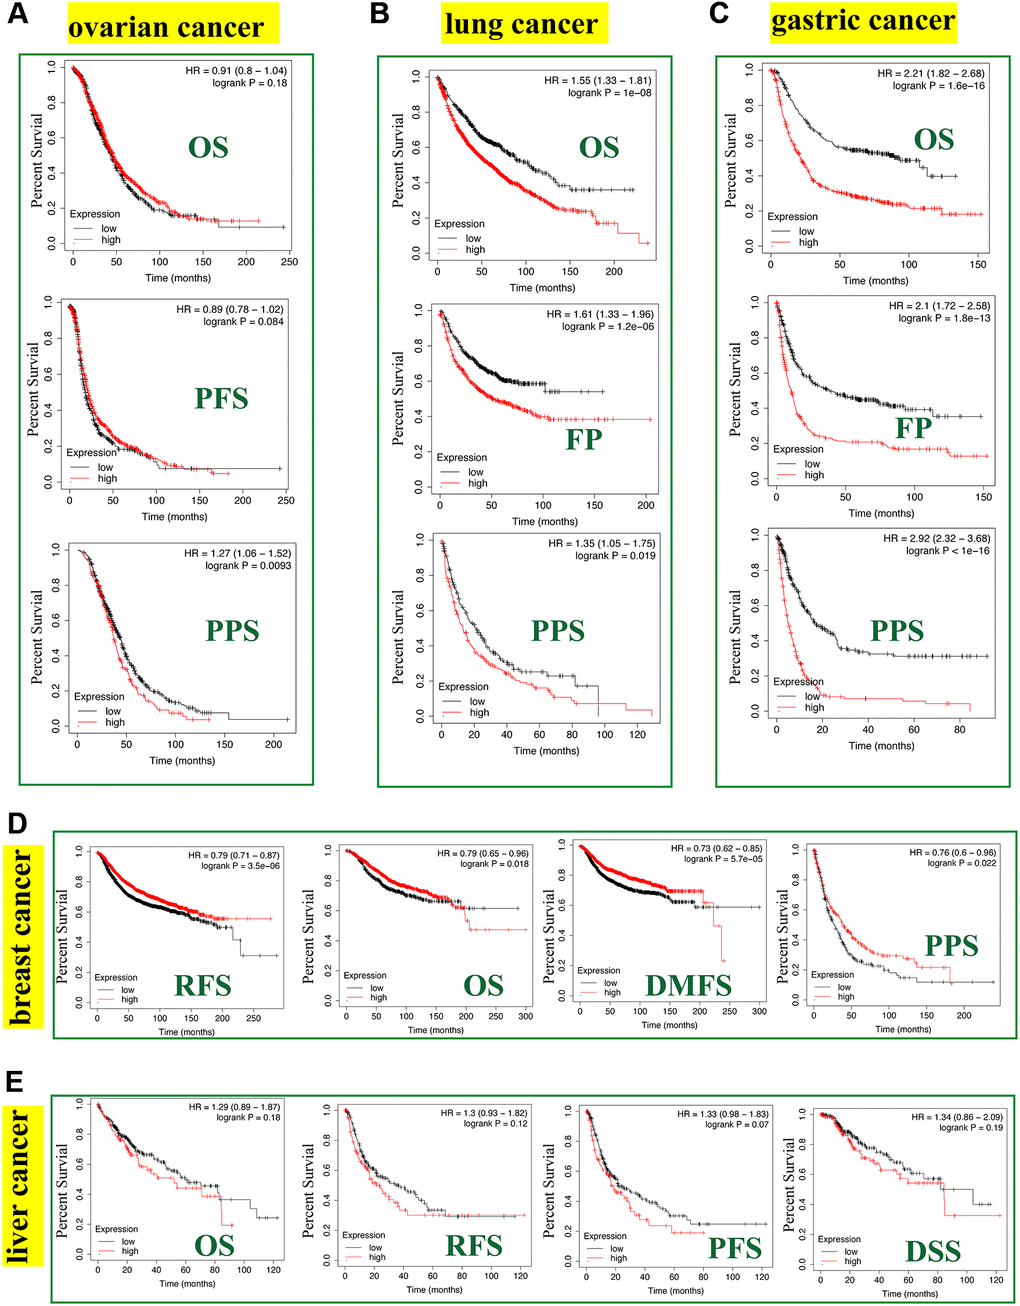
Figure 8.Correlation between the FASN gene and the survival outcome of tumors. We used the Kaplan-Meier plotter to carry out the survival analyses of FASN gene in breast cancer (A), ovarian cancer (B), lung cancer (C), gastric cancer (D), and liver cancer (E) cases.