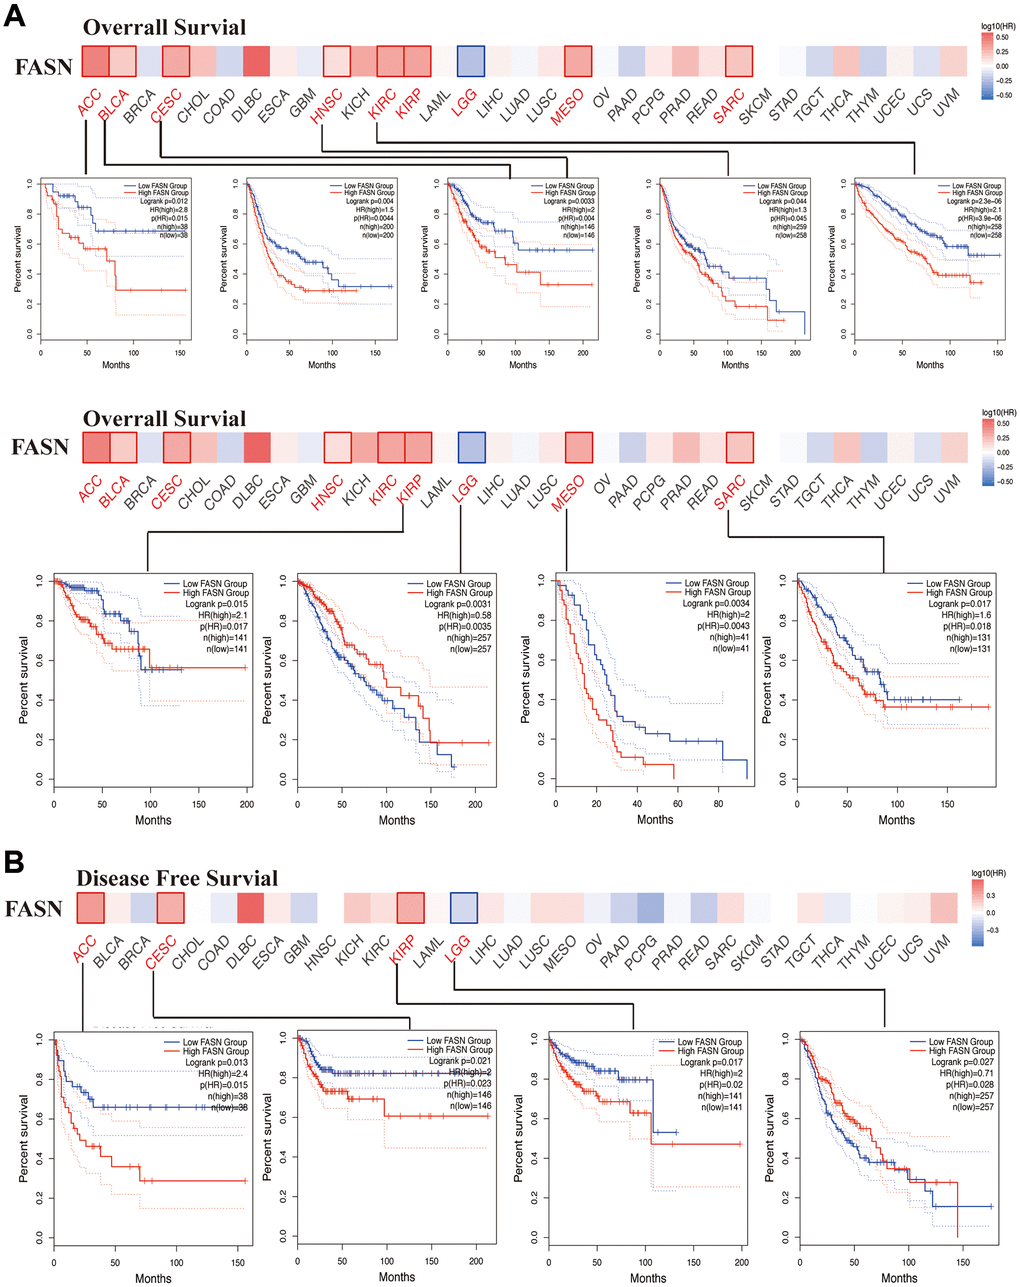
Figure 7.Correlation between FASN gene and the survival outcome of tumors. OS (A) and DFS (B) analyses of various tumors. The survival map and Kaplan-Meier curves with positive results are displayed.
Figure 7 — Landscape of the oncogenic role of fatty acid synthase in human tumors | Aging