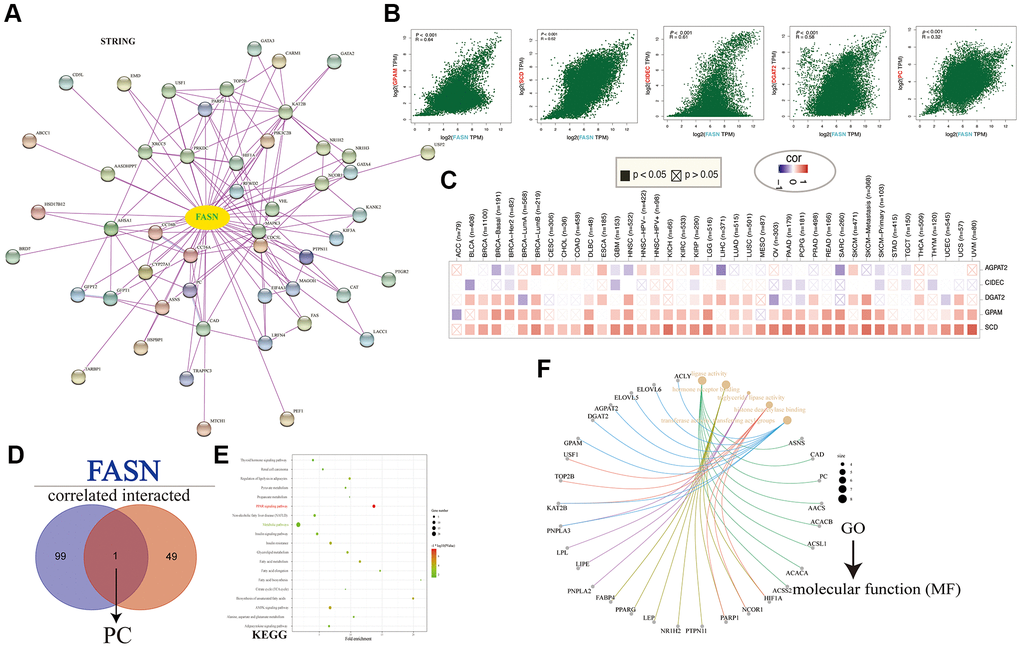
Figure 18.FASN-related gene enrichment analysis. (A) FASN-binding proteins. (B) Expression correlation between FASN and GPAM, SCD, CIDEC, DGAT2, and PC. (C) Corresponding heatmap across cancers. (D) The intersection of the FASN-binding and correlated genes. (E) KEGG pathway analysis. (F) GO (Molecular function) analysis.