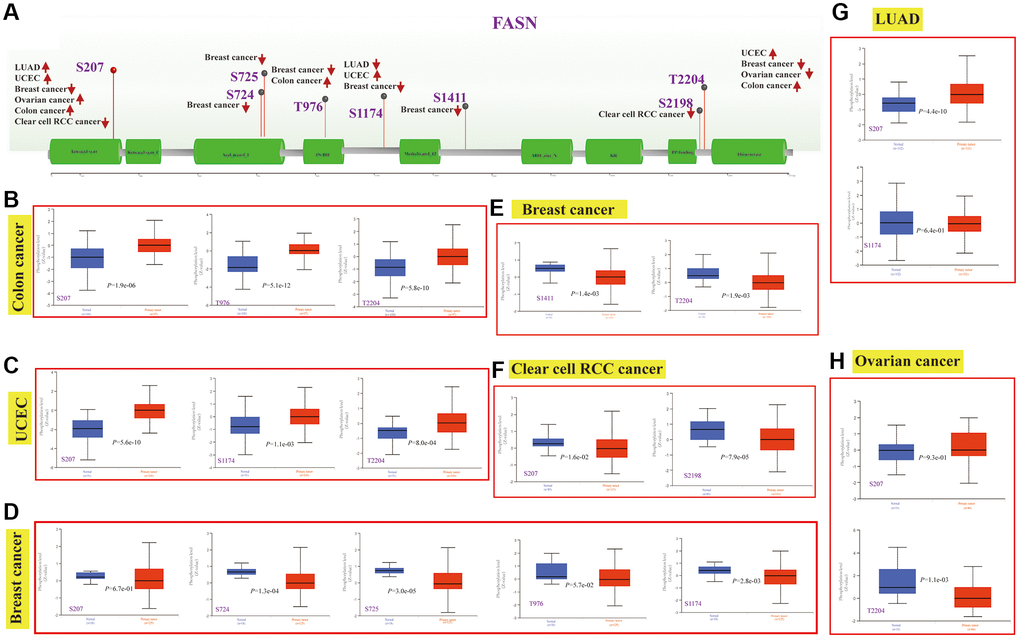
Figure 15.Phosphorylation analysis of the FASN protein. Phosphoprotein sites of the FASN protein are indicated in the schematic (A). Expression analysis of FASN phosphoprotein (NP_004595.4, S207, S724, S725, T976, S1174, S1411, S2198 and T2204 sites) between normal tissue and tumors, including colon cancer (B), UCEC (C), breast cancer (D, E), clear cell RCC (F), LUAD (G), and ovarian cancer (H).