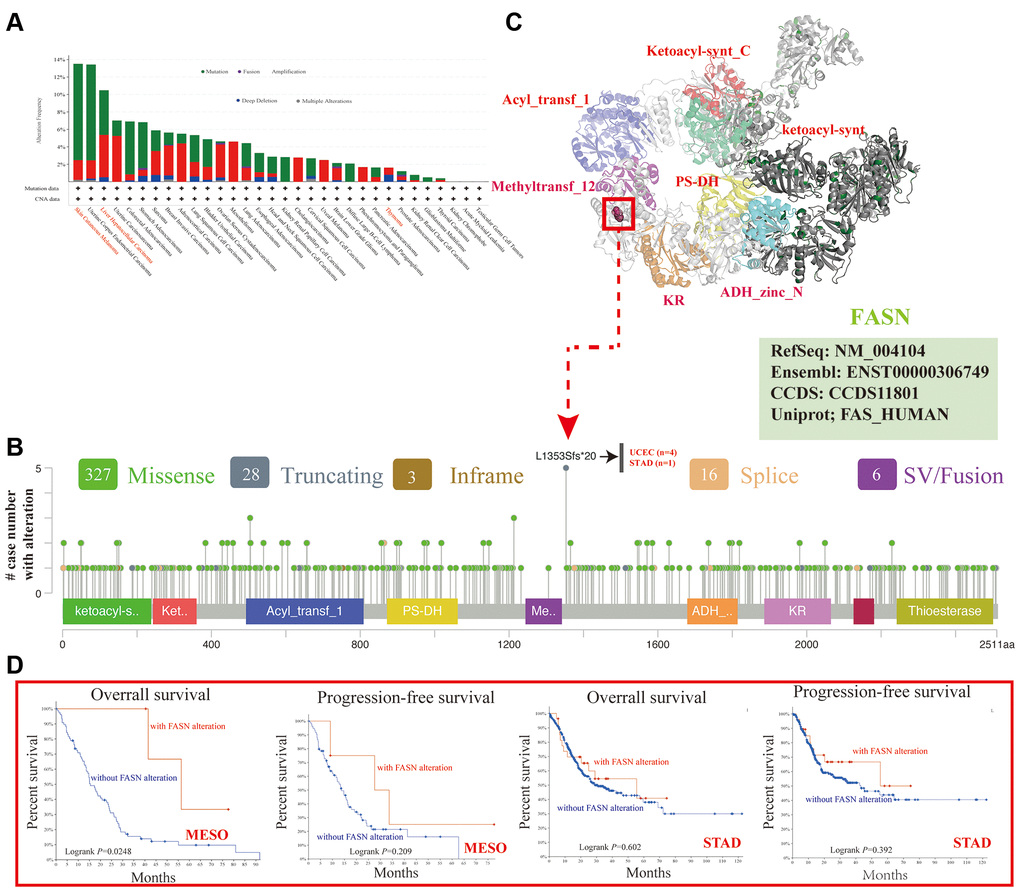
Figure 10.Mutation feature of FASN across various tumors. The alteration frequency with mutation type (A) and mutation site (B) is displayed. The mutation site with the highest alteration frequency (L1353Sfs*20) in the 3D structure of FASN (C). The potential correlation between mutation status and the OS and PFS of MESO and STAD (D).