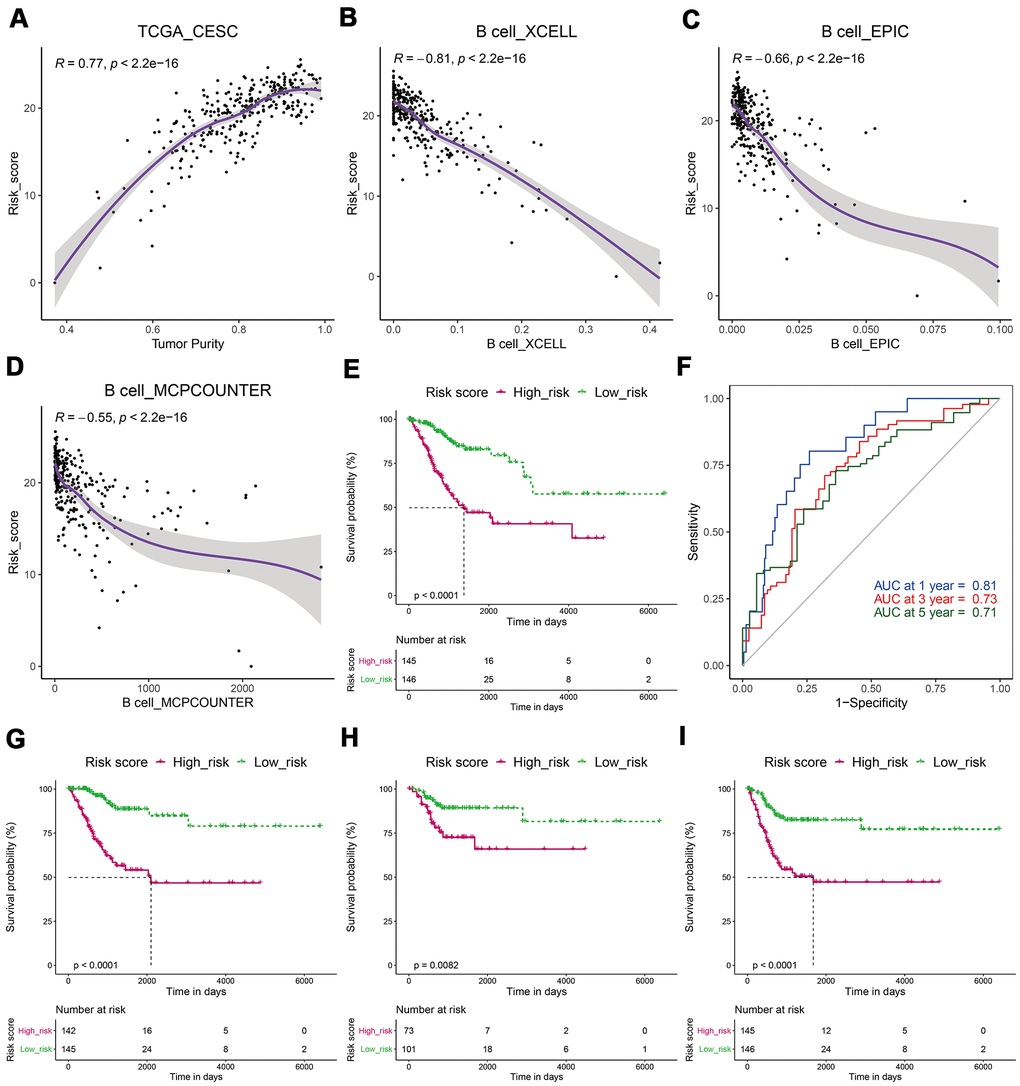
Figure 5.CESCs with low-risk scores had a better prognosis. (A) The risk score was significantly positively correlated with tumor purity. (B–D) The risk score was significantly negatively related to the B-cell infiltration level. (E) Kaplan–Meier analysis showed that patients in the low-risk subgroup had a longer OS. (F) ROC analysis suggested that the risk score had good predictive capability. (G–I) A Kaplan–Meier analysis showed that patients in the low-risk subgroup had longer DSS (G), DFI (H), and PFI (I).