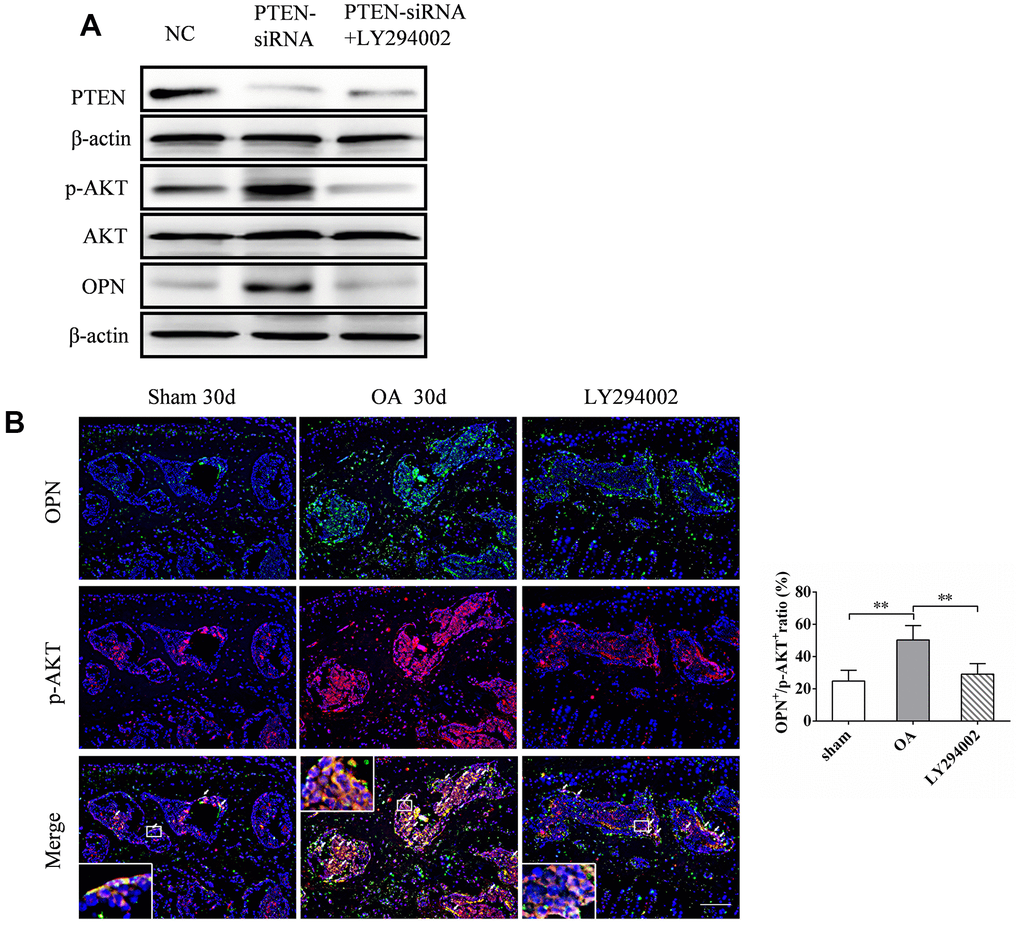
Figure 7.LY294002 inhibits OPN-mediated subchondral bone and cartilage degeneration in OA. (A) Western blot analysis of the expression of PTEN, p-AKT and OPN in MC3T3-E1 cells transfected with PTEN-siRNA and treated with LY294002 (10 μM) for 48 h. (B) Representative images and quantitative analysis of p-AKT and OPN co-immunostaining in the tibial subchondral bone in sham group, OA group and LY294002 treatment group. Positive cells were indicated with arrows. Boxed area is magnified in the corner. Scale bars = 50 μm, n = 6.
(C) TRAP staining of osteoclasts and immunostaining of OCN+ cells were performed on subchondral bone of tibia in sham group, OA group and LY294002 treatment group. Positive cells were indicated with arrows, scale bars = 50 μm, n=6. Safranin O-fast green staining and OARSI scores of tibial articular cartilage in sham group, OA group and LY294002 treatment group. Scale bars = 200 μm. Representative 3D reconstruction of micro-CT images of tibial subchondral bone in sham group, OA group and LY294002 treatment group; scale bars = 1 mm. Quantitative analysis of bone volume/total volume (BV/TV) and trabecular thickness (Tb. Th.), n=6. Representative immunostaining and quantitative analysis of COL 10+, MMP-13+ cells in articular cartilage in sham group, OA group and LY294002 treatment group. Scale bars = 50 μm, n=6. Data are shown as mean ± s. d. and were analyzed by one-way ANOVA, *P < 0.05, **P < 0.01.