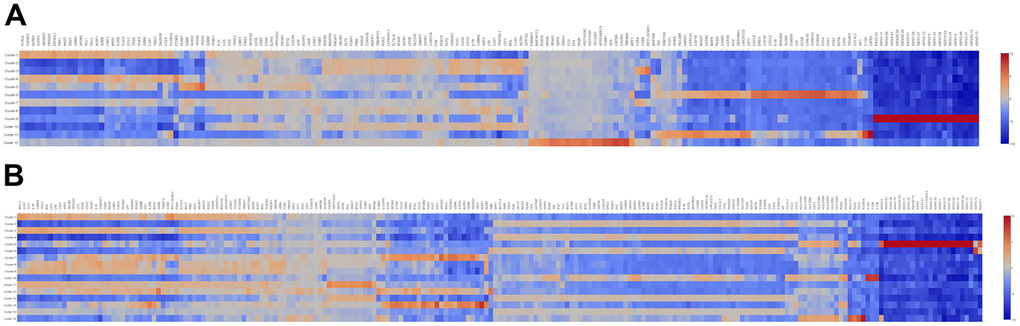
Figure 2.The heatmap of DEGs in different cell clusters between the SLE and NC groups. (A) The heatmap of DEGs in 12 cell clusters of the NC group. (B) The heatmap of DEGs in 16 cell clusters of the SLE group.
Figure 2 — Immune cell and TCR/BCR repertoire profiling in systemic lupus erythematosus patients by single-cell sequencing | Aging