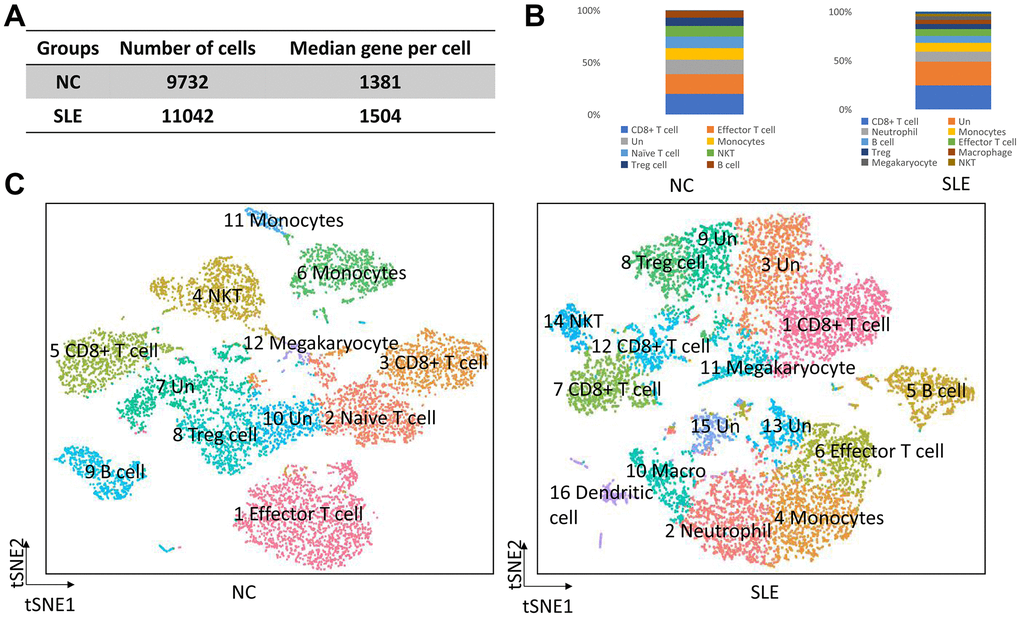
Figure 1.The overview of clusters in the SLE and NC. The accumulation of neutrophil, macrophage, and dendritic cells in SLE. (A) The cell number and median gene per cell were generated in NC and SLE. (B) The bar chart showed the immune cell types in NC and SLE. (C) The t-distributed stochastic neighbor embedding (t-SNE) analysis of cell clusters between NC and SLE. Un: undefined cell types, macro: macrophage cells.