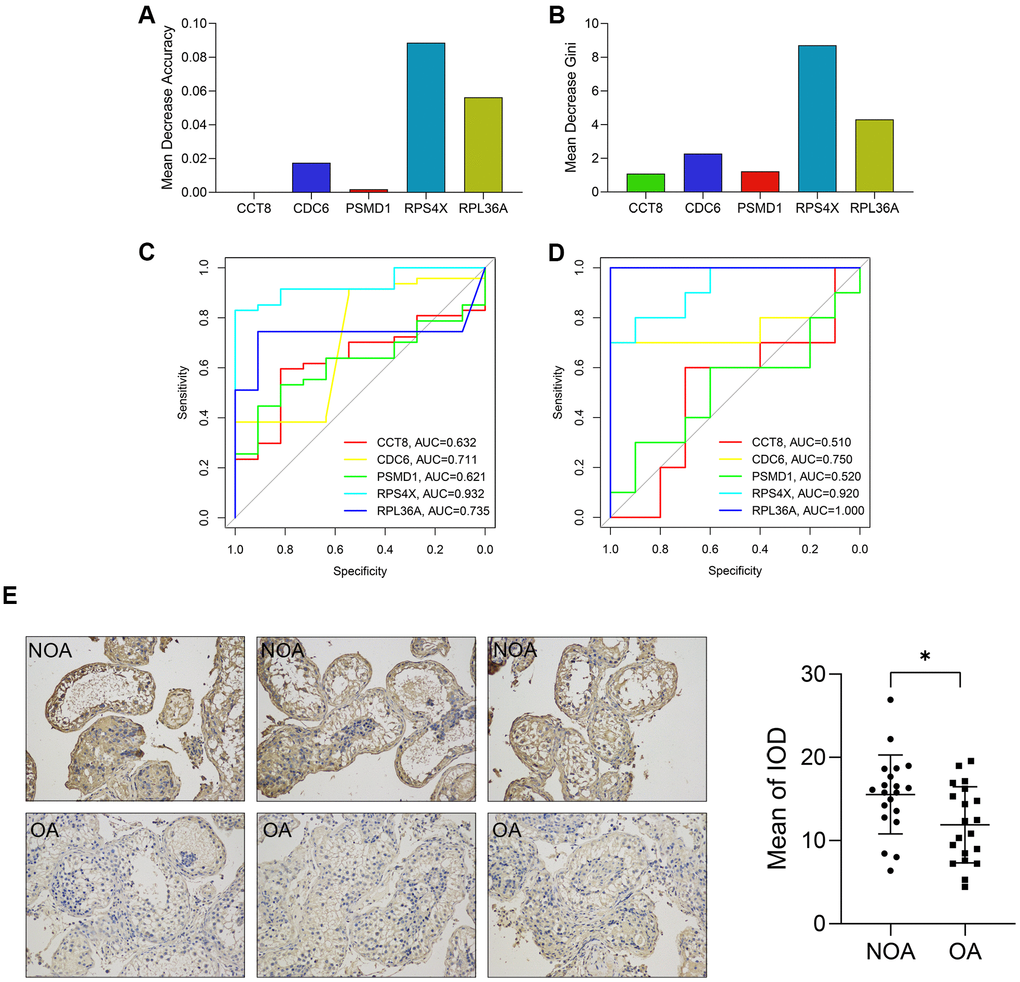
Figure 6.The diagnostic value of each variable in the random forest model. (A, B) The Mean Decrease Accuracy (A) and Mean Decrease Gini (B) of the variables. (C, D) The ROCs showed the predictive performance of each gene in the training (C) and external validation cohorts (D). (E) The expression of RPS4X in the testicular biopsy samples from 20 NOA (up) and 20 OA (down) patients (x200). ROC, receiver operating curve. AUC, area under curve; NOA, non-obstructive azoospermia; OA, obstructive azoospermia; IOD, integral optical density. *, P < 0.05.