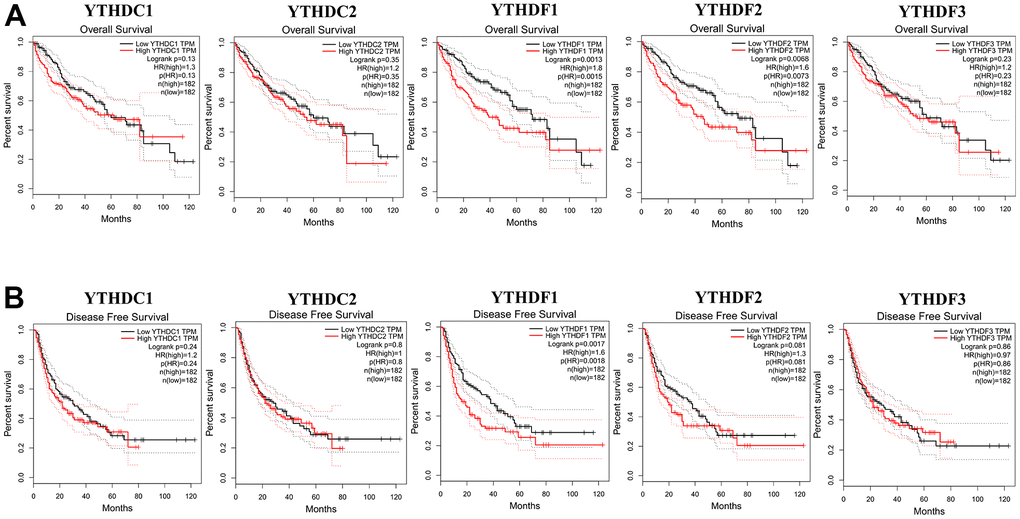
Figure 3.The correlations of YTH domain family expression with OS and PFS in HCC patients. Kaplan-Meier plotter was used to assess the correlation of YTH domain family members with the patients’ OS (A) and PFS time (B).
Figure 3 — YTH domain family: potential prognostic targets and immune-associated biomarkers in hepatocellular carcinoma | Aging