Submit an Article
Navigate
Home
Editorial Board
Editorial Policies
Current Volume
Archive
Scientific Integrity
Publication Ethics Statements
Interviews with Outstanding Authors
Newsroom
Sponsored Conferences
Podcast
Contact
Special Collections
Submit an Article
Online ISSN: 1945-4589
Research Paper
|
Volume 13, Issue 20
|
pp. 23810–23830
CCR5 is a prognostic biomarker and an immune regulator for triple negative breast cancer
Back to article
Figure 7
(7 of 8)
−
100%
+
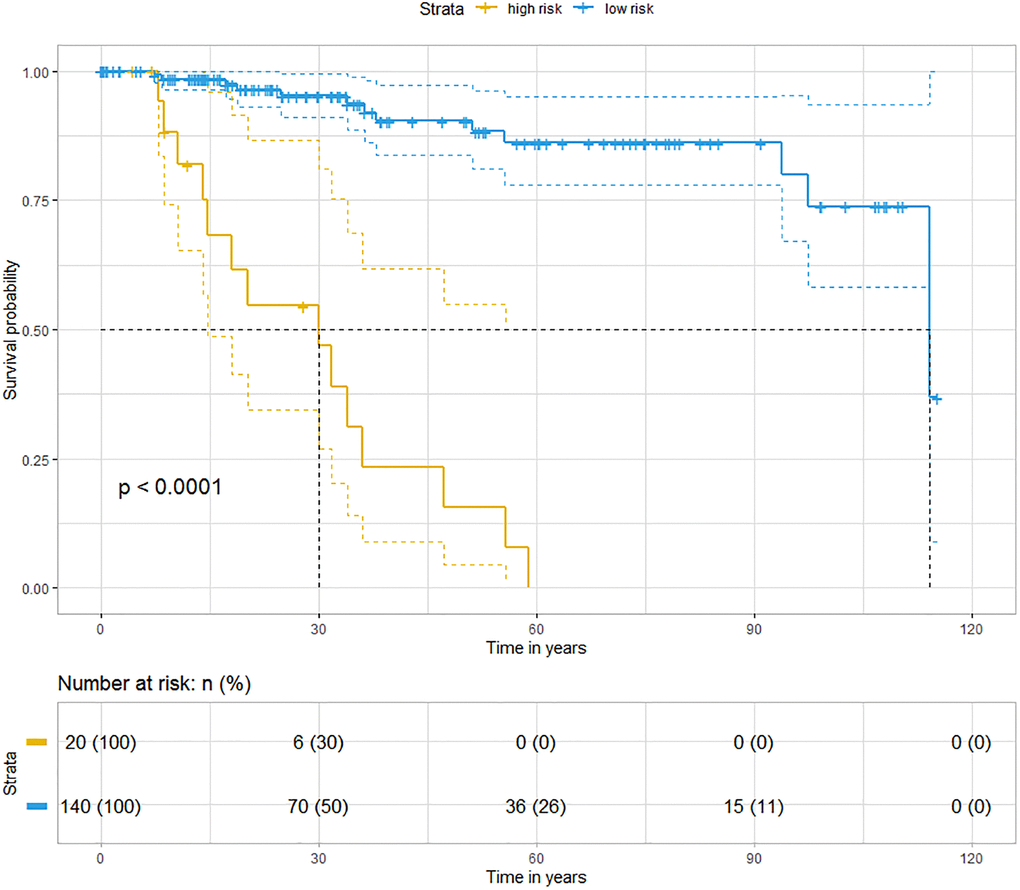
Figure 7.
Kaplan-Meier analyses indicate that patients in low risk group have better OS than those in high risk group (blue represents low risk group and yellow represents high risk group, Logrank
p
< 0.0001).