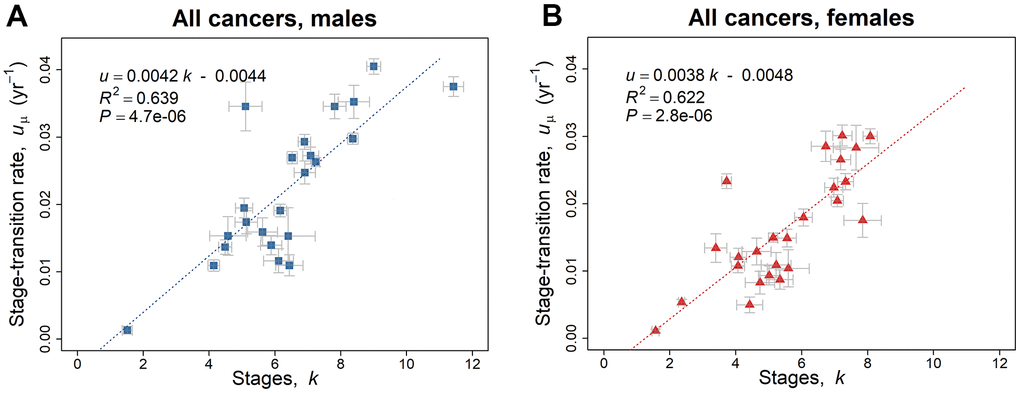
Figure 2.Linear regression trend line of the geometric mean of the stage-transition rate uμ versus the number of stages k, employing the 2010–2013 SEER data based on the model of Equation 5. (A) Blue squares represent values for males (Table 1A). (B) Red triangles represent values for females (Table 1B). The gray bars indicate one standard error in the estimate of the parameters by non-linear least squares.