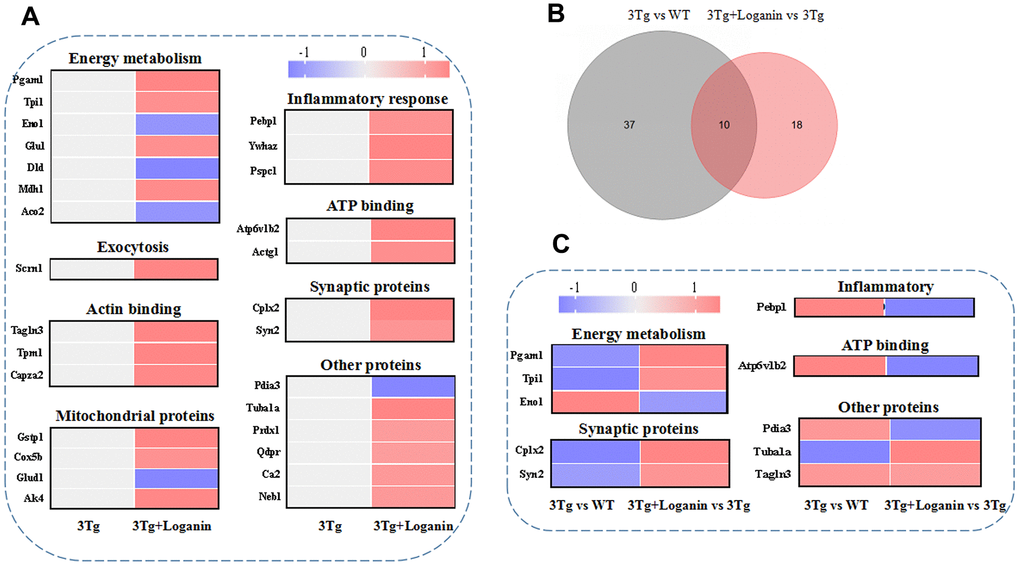
Figure 4.Functional categories, heatmap analysis and Venn diagram analysis. (A) Functional categories and heatmap analysis of 28 differentially expressed proteins from the 3xTg-AD mice treated with loganin compared to the control mice. (B) The Venn diagram analysis. (C) Functional categories and heatmap analysis of the co-differentially expressed proteins among three groups. Red expressed up-regulated and blue expressed down-regulated. The brighter the image, the greater the fold change.