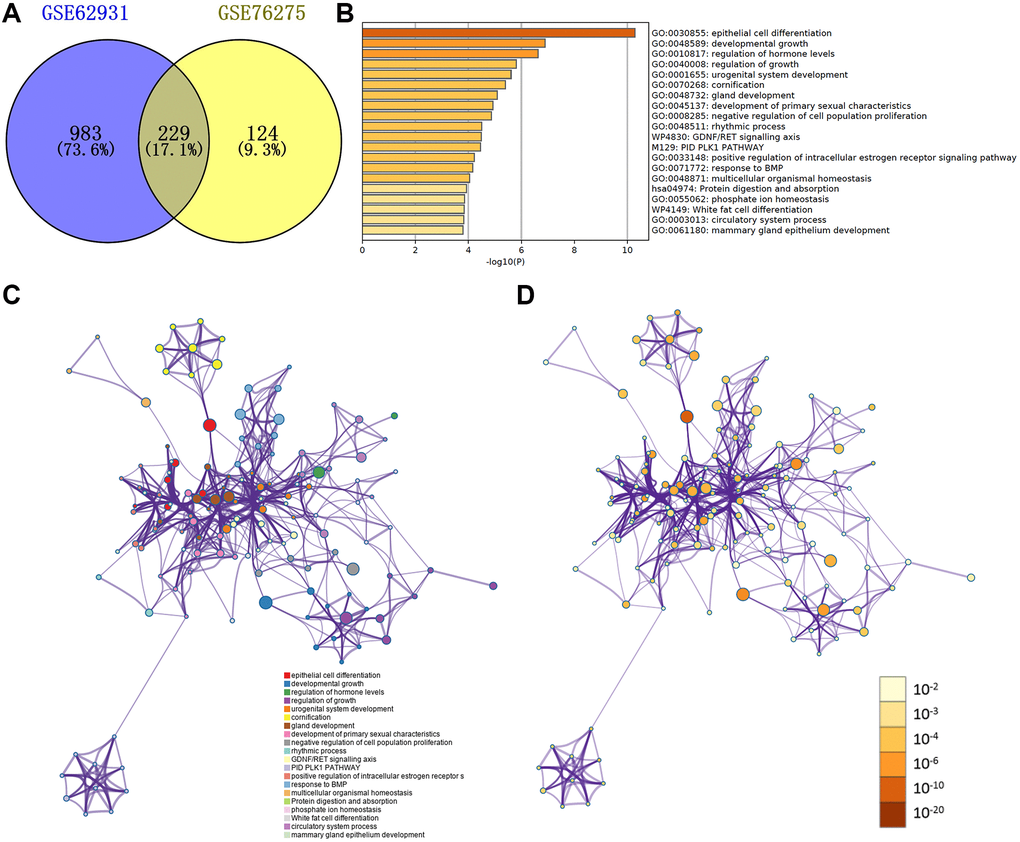
Figure 3.(A) Venn plot of DEGs in GSE62931 and GSE76275. (B) GO terms and enriched KEGG pathways of the DEGs. (C) DEGs colored by cluster ID. DEGs in the same cluster ID nodes are closely related to each other. (D) DEGs colored by P-value. Terms with more significant P-values contain more genes.