Submit an Article
Navigate
Home
Editorial Board
Editorial Policies
Current Volume
Archive
Scientific Integrity
Publication Ethics Statements
Interviews with Outstanding Authors
Newsroom
Sponsored Conferences
Podcast
Contact
Special Collections
Submit an Article
Online ISSN: 1945-4589
Research Paper
|
Volume 13, Issue 20
|
pp. 23689–23701
Analysis of gut microbiota and metabolites in patients with rheumatoid arthritis and identification of potential biomarkers
Back to article
Figure 5
(5 of 6)
−
100%
+
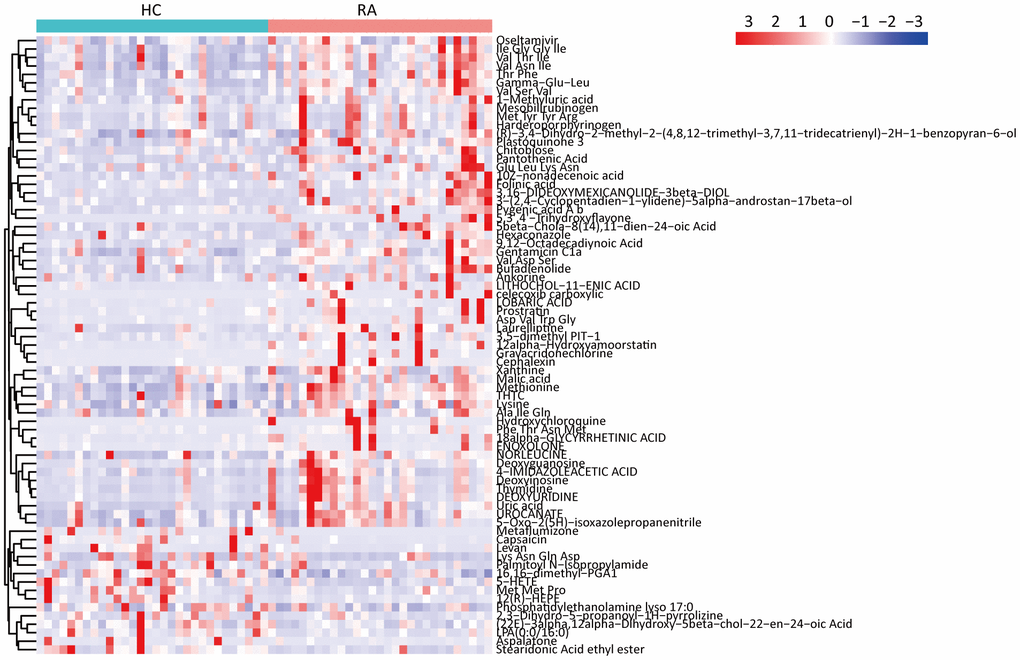
Figure 5.
Significantly changed metabolites heatmap in feces samples between HC and RA group.