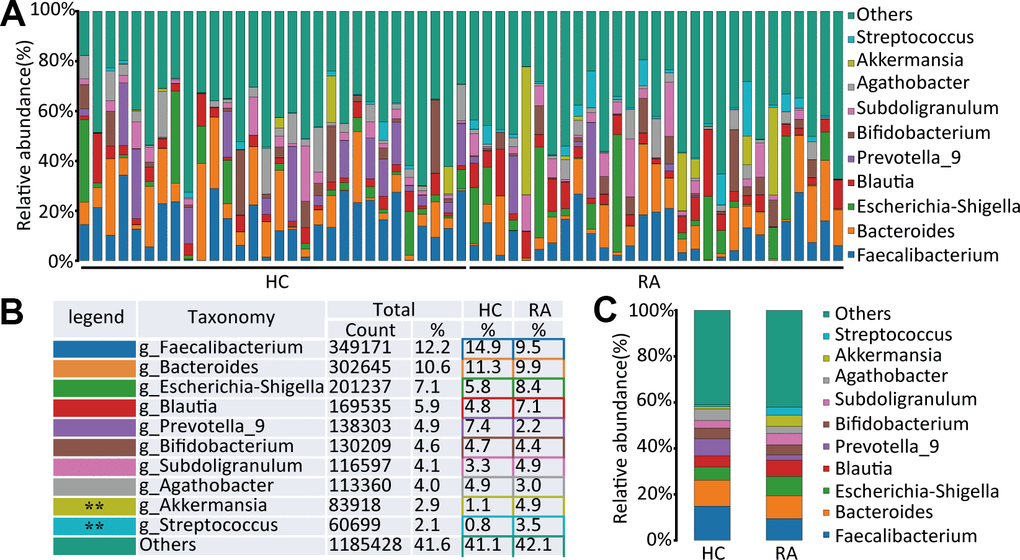
Figure 3.The species abundance at genus level. (A) Relative abundance of gut microbiota in every samples at the genus level, n=30 for HC group and n=29 for RA group. (B, C) Component proportion of gut microbiota at the genus level in HC and RA group.