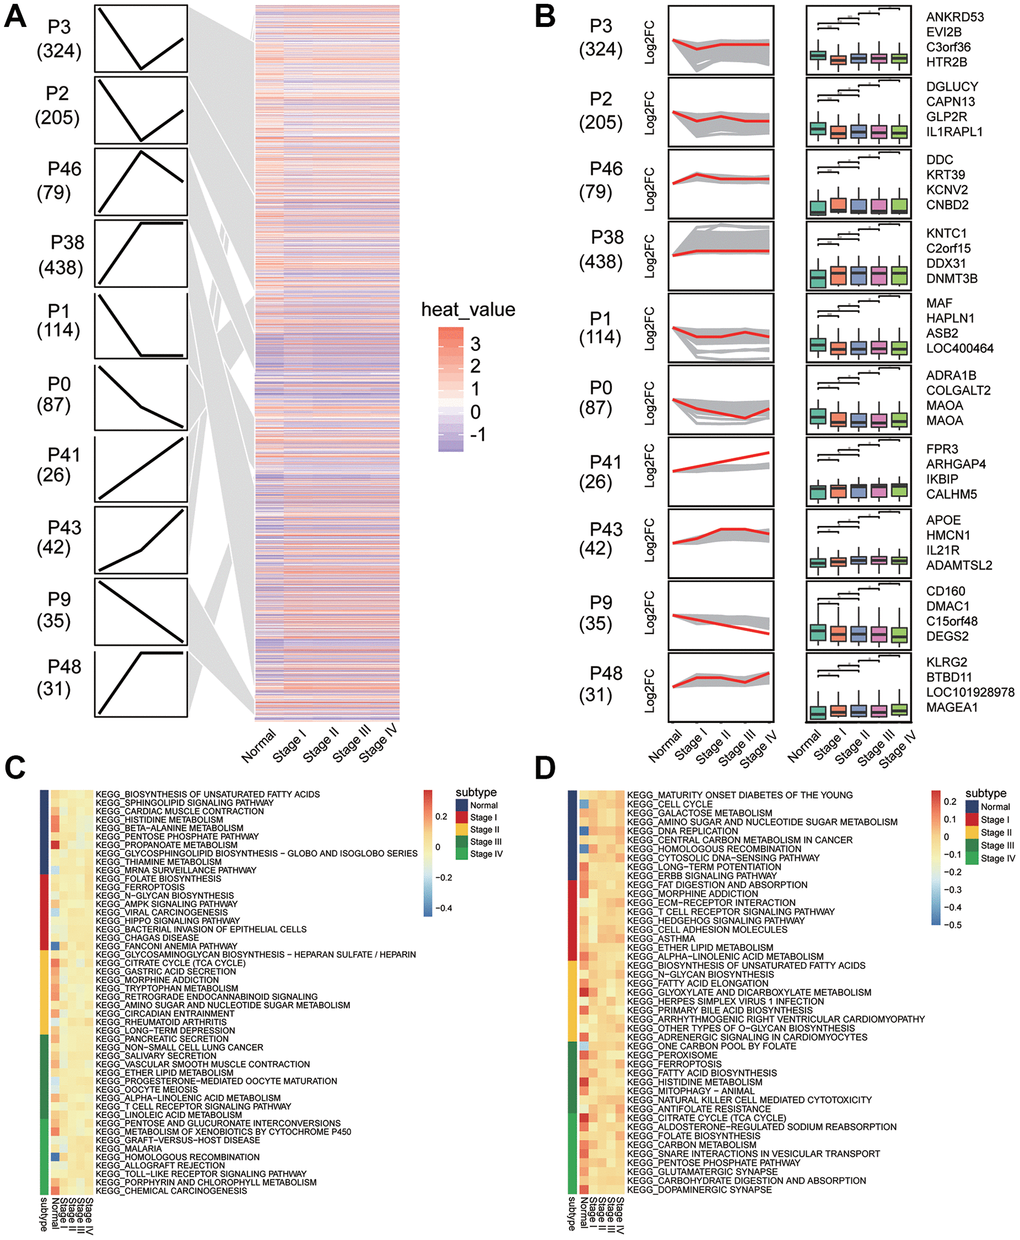
Figure 5.Sets of genes showing persistent up- or down-regulation during gastric cancer development. (A) Heatmap of gene sets with persistent under- or overexpression from normal to stage IV of gastric cancer. (B) The top four genes with the greatest fold-change in transcription level in 10 clusters. (C) Signaling pathways that are consistently up-regulated as tumors develop. (D) Signaling pathways that are consistently down-regulated as tumors develop.