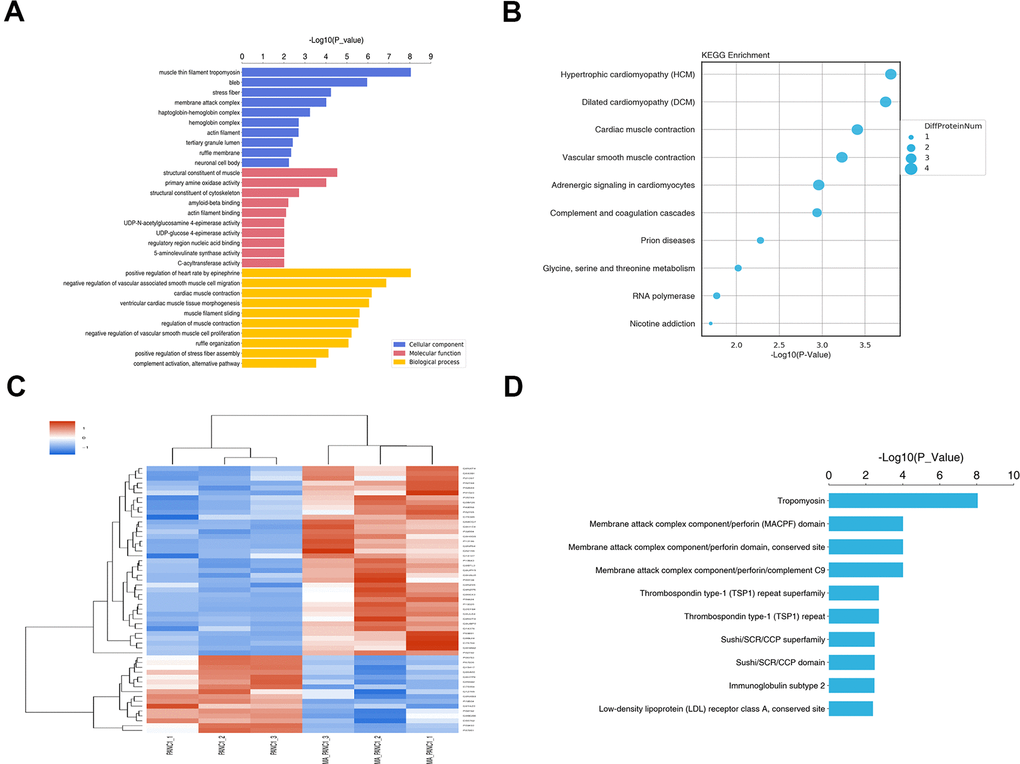
Figure 7.GO and KEGG pathway enrichment analysis of DEPs between PANC-1 and MA treated PANC-1. (A) Go enrichment analysis of DEPs in PANC-1 cells post MA treatment. The results showed the GO Term of the top 10 enrichment significance. (B) The top 10 enriched pathways for DEPs. (C) Differential protein group Cluster analysis. (D) The top 10 significantly enriched protein domain classification statistics histogram.