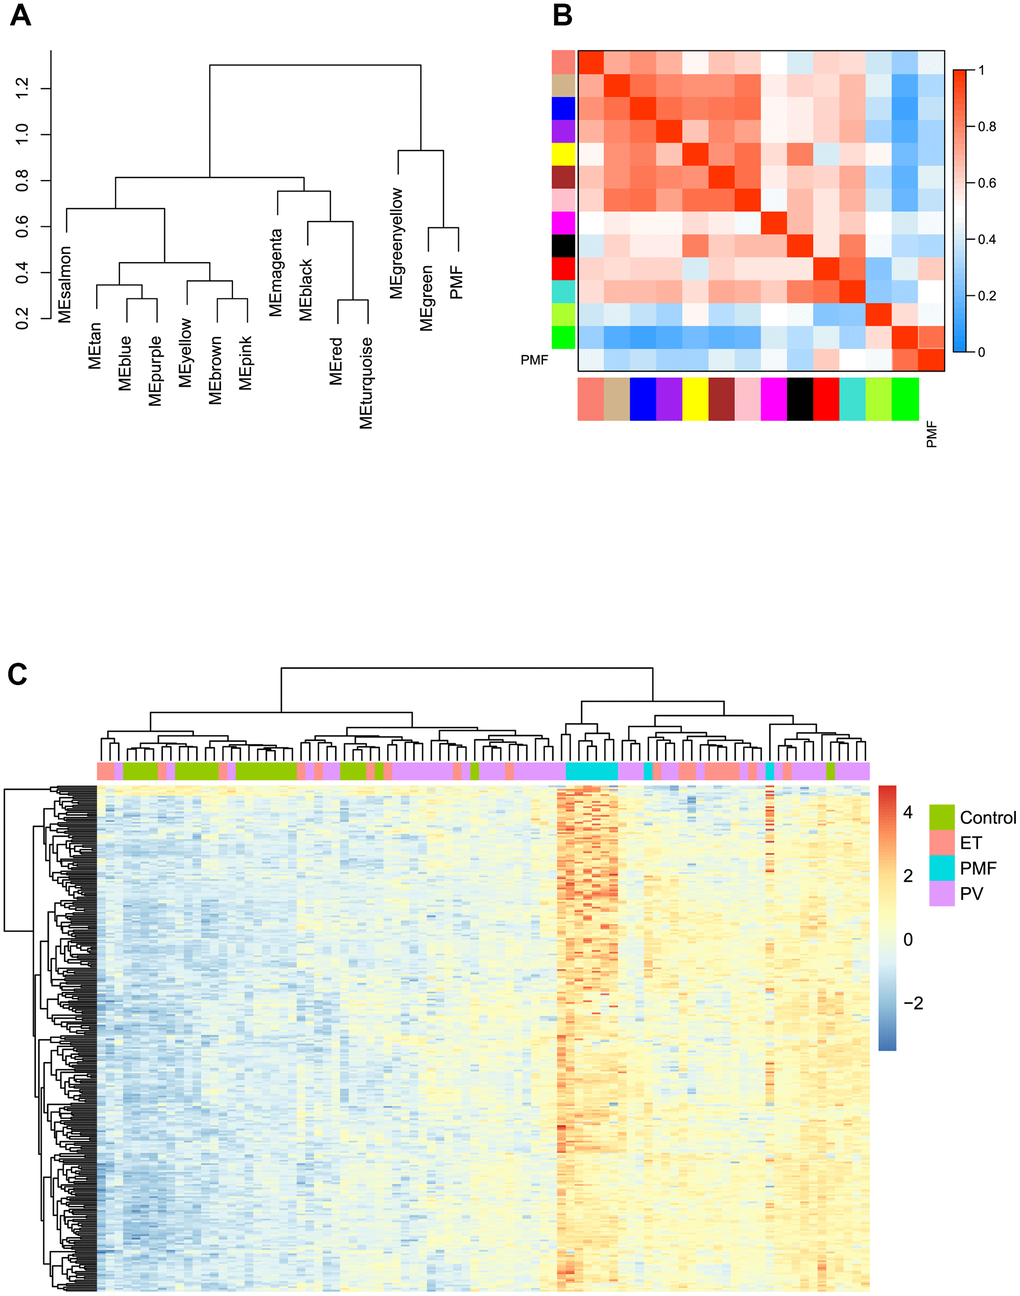
Figure 5.(A) The cluster dendrogram of adjacencies in the eigengene network. (B) The heat map of adjacencies in the eigengene network. Blue represented a negative correlation, while red represented a positive correlation. (C) Green module genes expression heat map of different groups (Control, ET, PV and PMF).