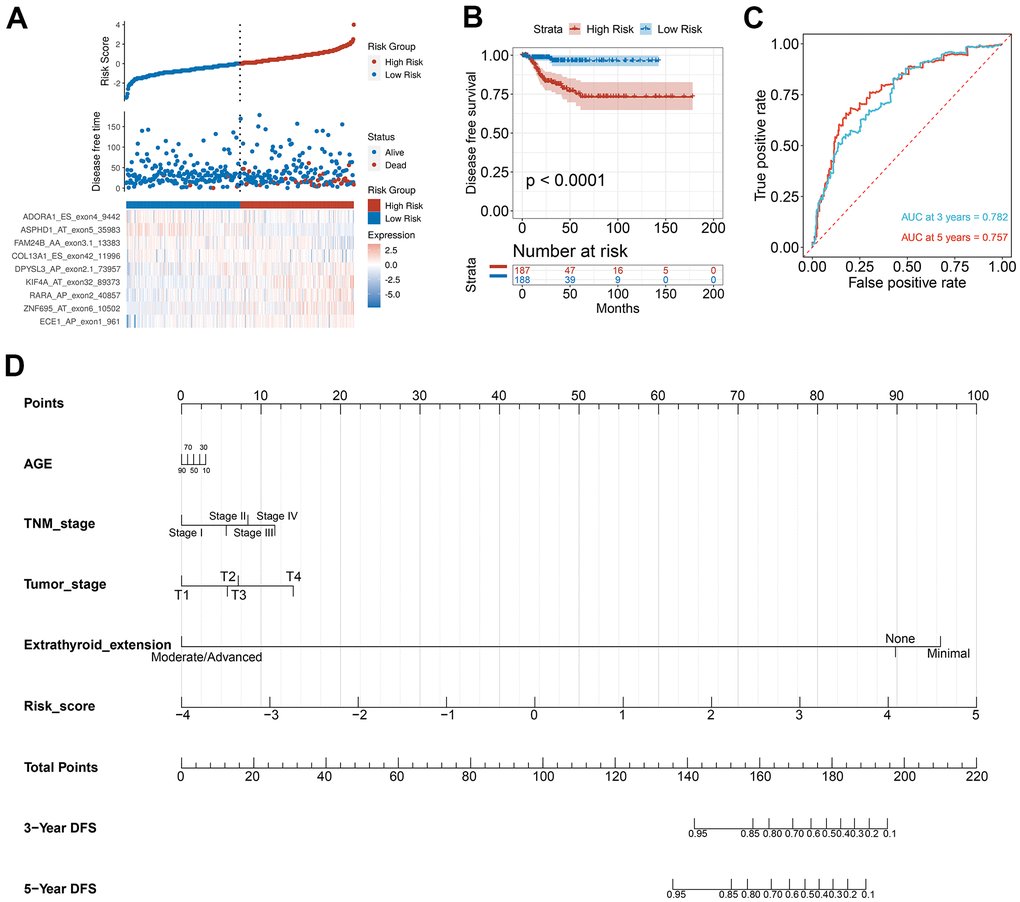
Figure 7.Selection of PTC feature genes and construction of a prognosis model. (A) Identification capability of the prognostic model of the low-risk and high-risk groups. (B) Kaplan-Meier curves of prognostic model for DFS of PTC patients. (C) ROC curves of prognostic model for the 3- and 5-year DFS of PTC patients. (D) Nomogram for predicting PTC patient’s 3- and 5-year DFS.