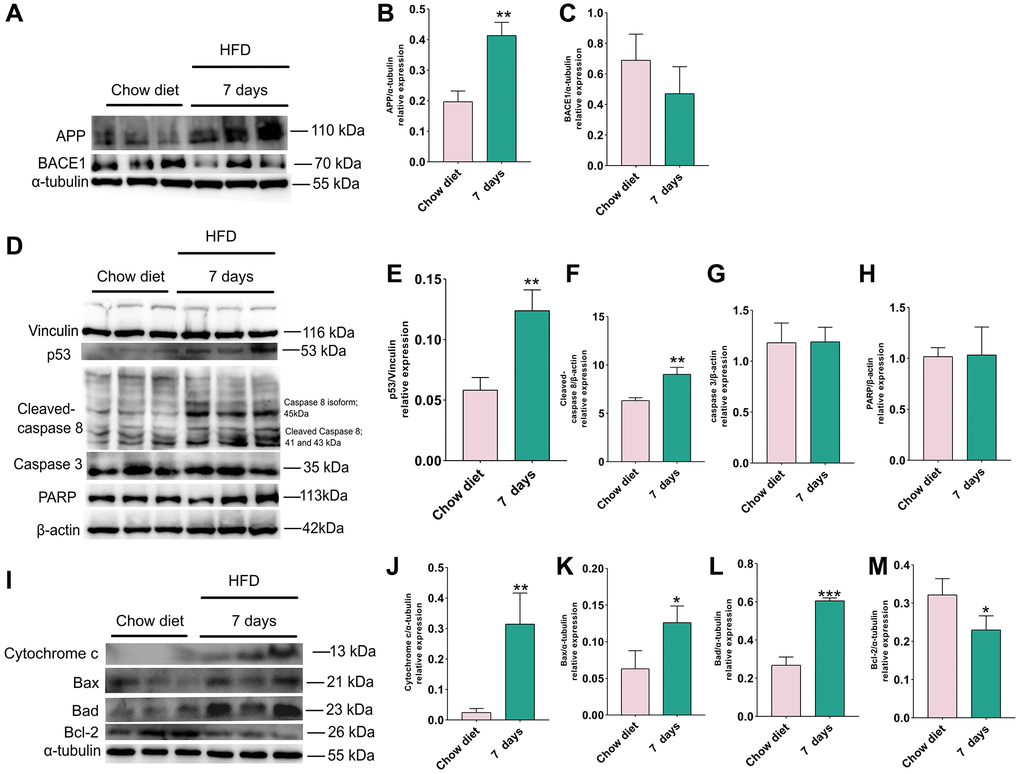
Figure 3.Changes of APP, BACE1 and apoptosis proteins after 7 days of HFD in the mice cerebellum. (A) Western blots and (B–C) densitometric analysis for APP, BACE1 in the supernatants of mice cerebellum (n = 3). (D) Western blot and (E–H) densitometric quantification of p53 (E), cleaved-caspase8 (F), caspase 3 (G), PARP (H) indicated (n = 3). (I) Western blot analysis of apoptotic proteins in cerebellum tissue lysates of indicated day 7 after HFD exposure for mice (n = 3). (J–M) Quantification of cytochrome C protein (J), Bax (K), Bad (L), Bcl-2 (M). Vinculin, β-actin and α-tubulin as a loading control. Values are means ± SD. *P < 0.05 and **P < 0.01 versus chow diet; by two-tailed Student’s t test.