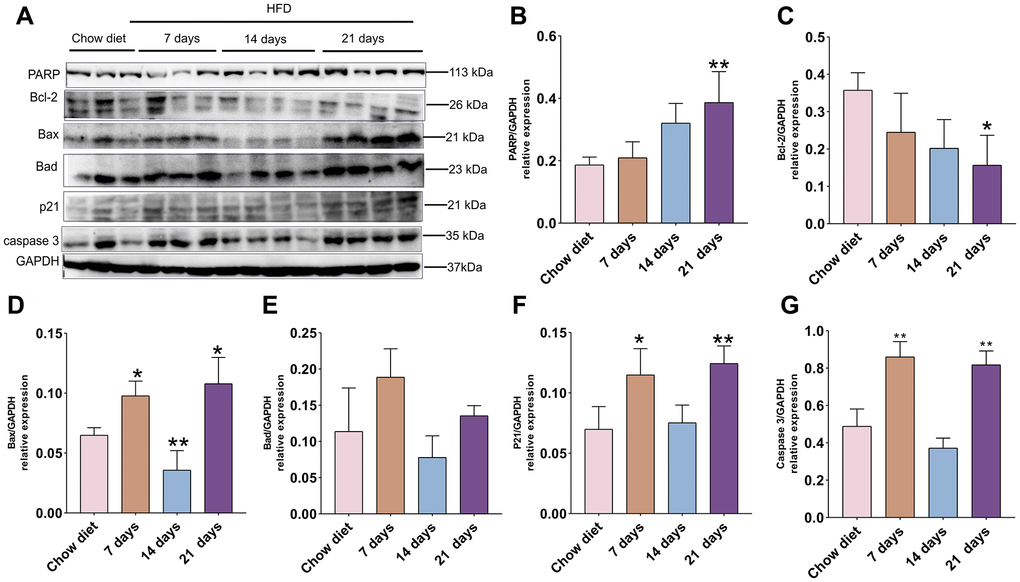
Figure 2.Association of apoptosis and HFD in mice cerebral cortex at separate times. (A) Western blot analysis of cerebral cortex tissues of mice with HFD and chow diet controls (n = 3 to 4 per group). (B–G) Quantification of PARP (B), Bcl-2 (C), Bax (D), Bad (E), p21 (F), caspase3 (G). GAPDH as a loading control. Values are presented as means ± SD. *P < 0.05 and **P < 0.01 versus chow diet; one-way ANOVA by Tukey’s test.