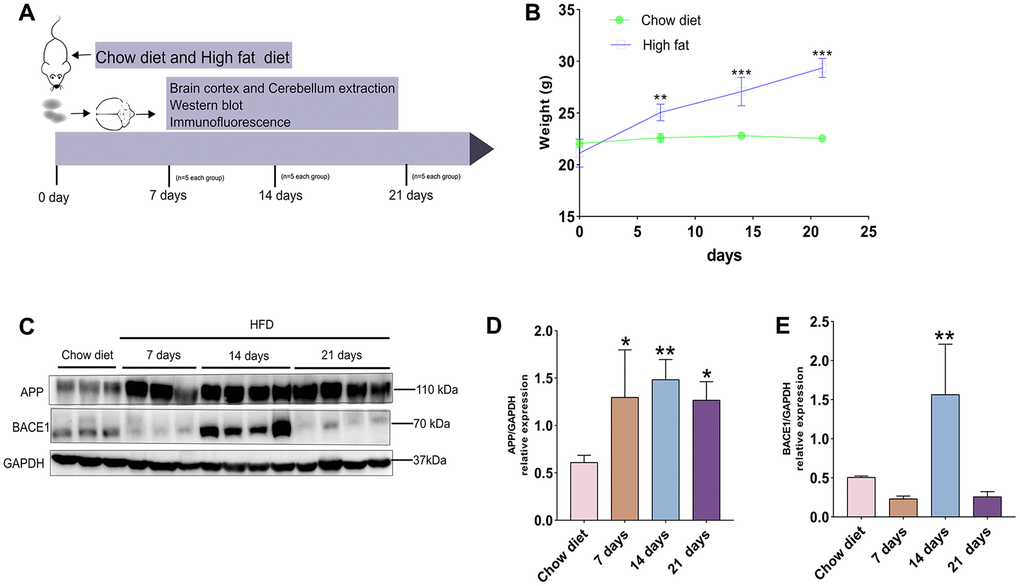
Figure 1.A timeline exhibiting expression changes of APP and BACE1 after short-term HFD exposure for mice cerebral cortex. (A) Experimental scheme for testing the effect of short period HFD on brain of adult mice. (B) Body weight curve of the two treatment groups at different time courses. (C) Western blotting and (D–E) densitometry analysis for APP and BACE1 from cerebral cortex tissue lysates obtained from mice with chow diet and HFD (n = 3 to 4 per group). GAPDH, glyceraldehyde-3-phosphate dehydrogenase. Diet compositions are shown in Table 1. Data shown as means ± SD. *P < 0.05, **P < 0.01, and ***P < 0.001 vs. chow diet group, by two-way ANOVA followed by Bonferroni’s post hoc test for body weight analysis and one-way ANOVA by Tukey’s test for densitometry assay.