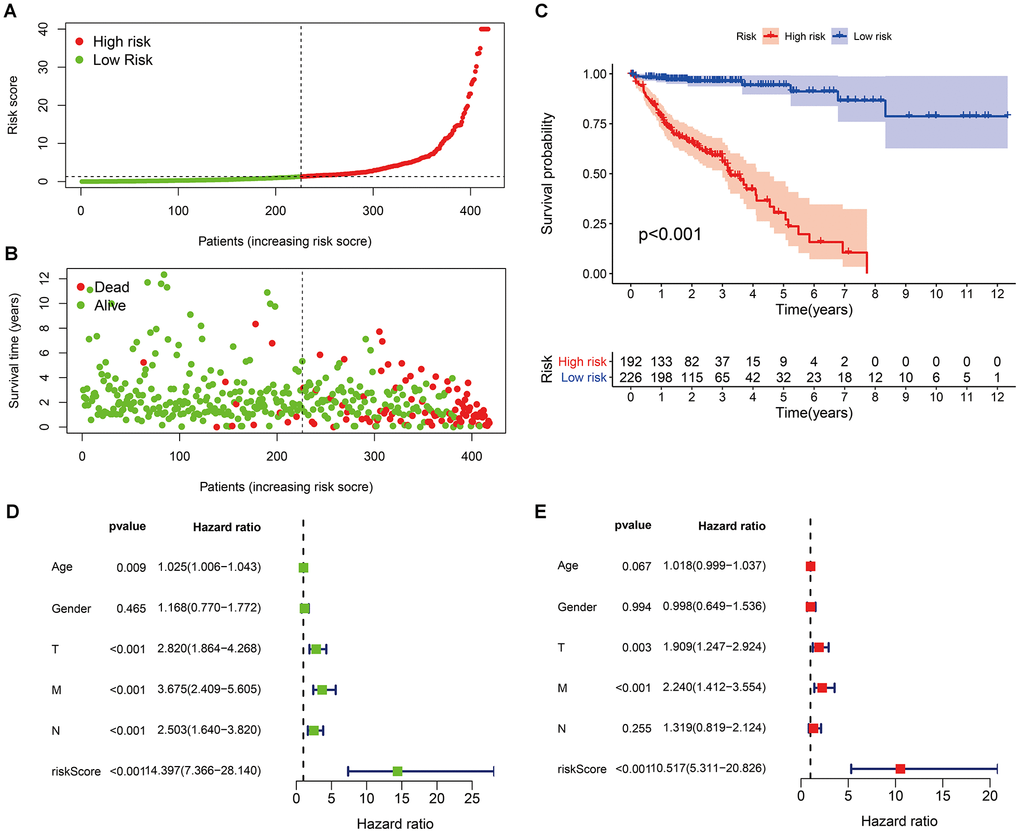
Figure 3.Risk scores (A) and survival outcomes (B) of each patient; (C) survival curves of high-risk group and low-risk group patients; (D) univariate and (E) multivariate Cox regression analyses of the risk score model and clinicopathological characteristics.