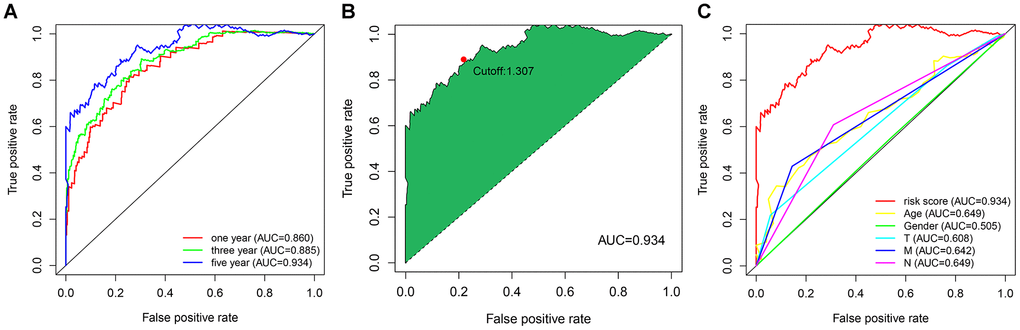
Figure 2.(A) The ROC curves for predicting the 1-, 3-, and 5-year OS; (B) identification of the maximum inflection point as the optimal cut-off value on the 5-year ROC curve; (C) comparison of the risk score model and clinicopathological characteristics in predicting the 5-year OS.