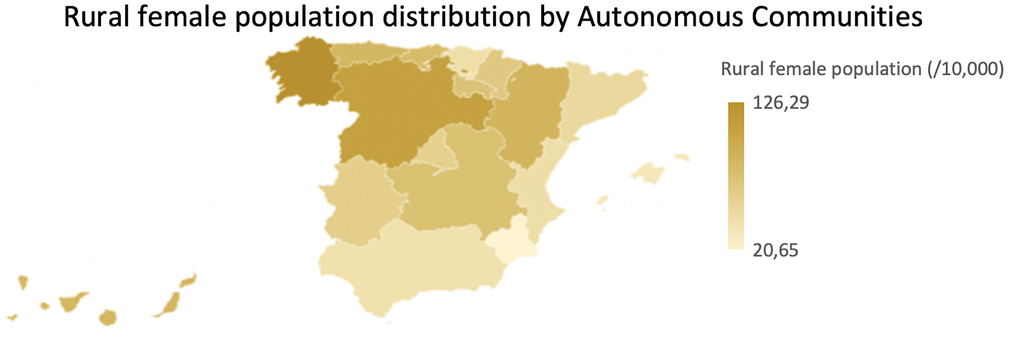
Figure 11.Rural female population distribution map by Autonomous Communities. Normalized rural female population (per 10.000 inhabitants) by Autonomous Communities.
Figure 11 — Sex, rurality and socioeconomical status in Spanish centennial population (2017) | Aging